Hi @Francois
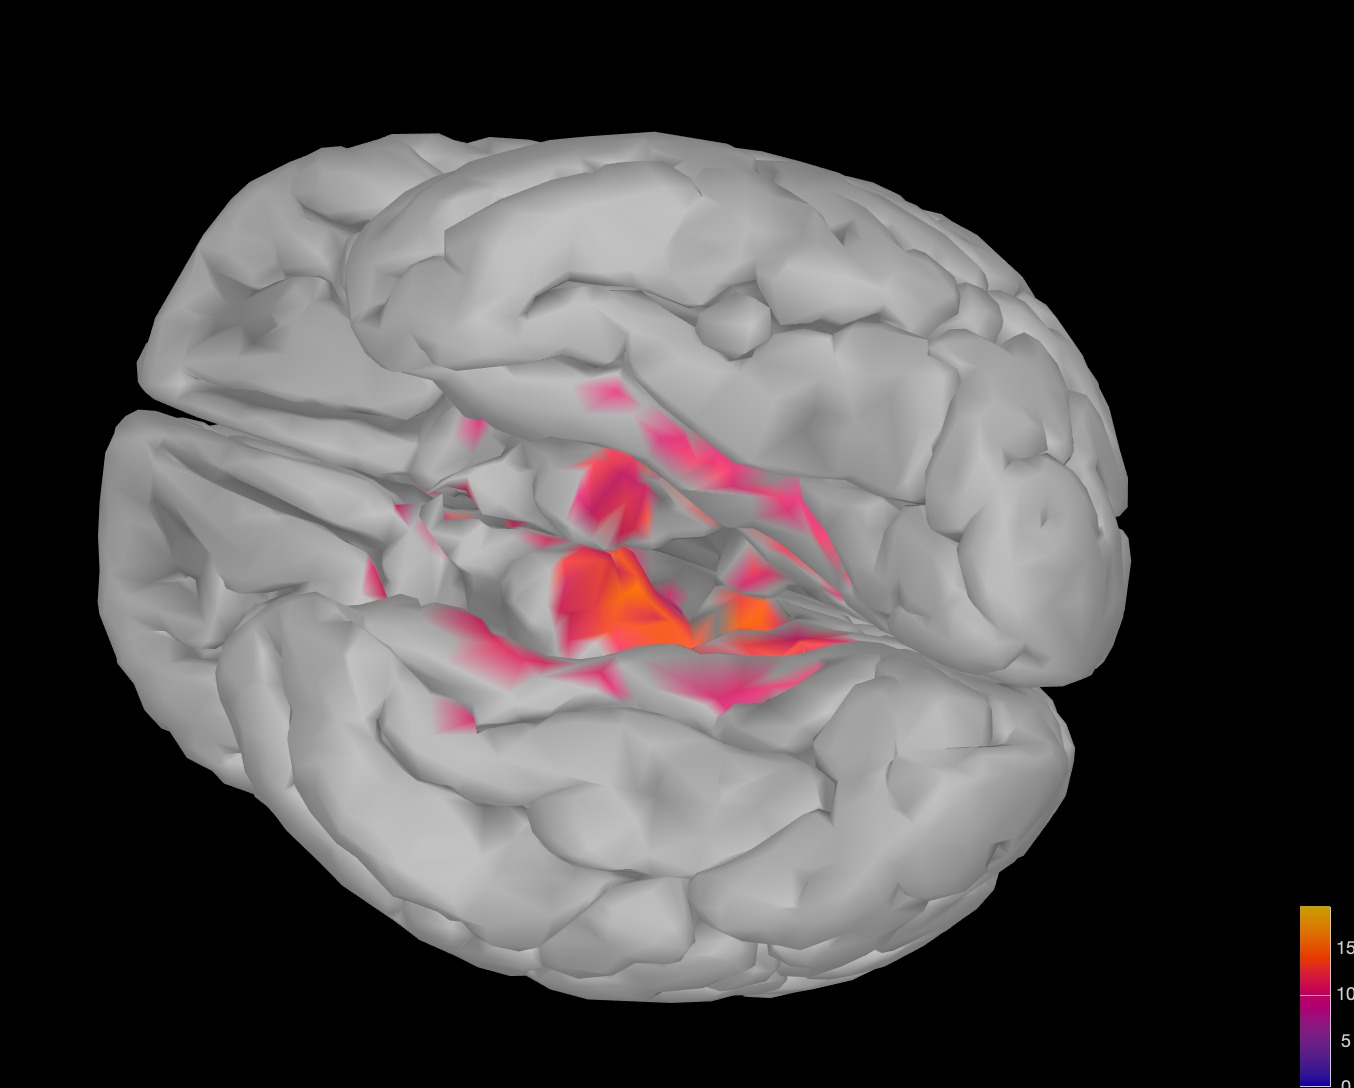
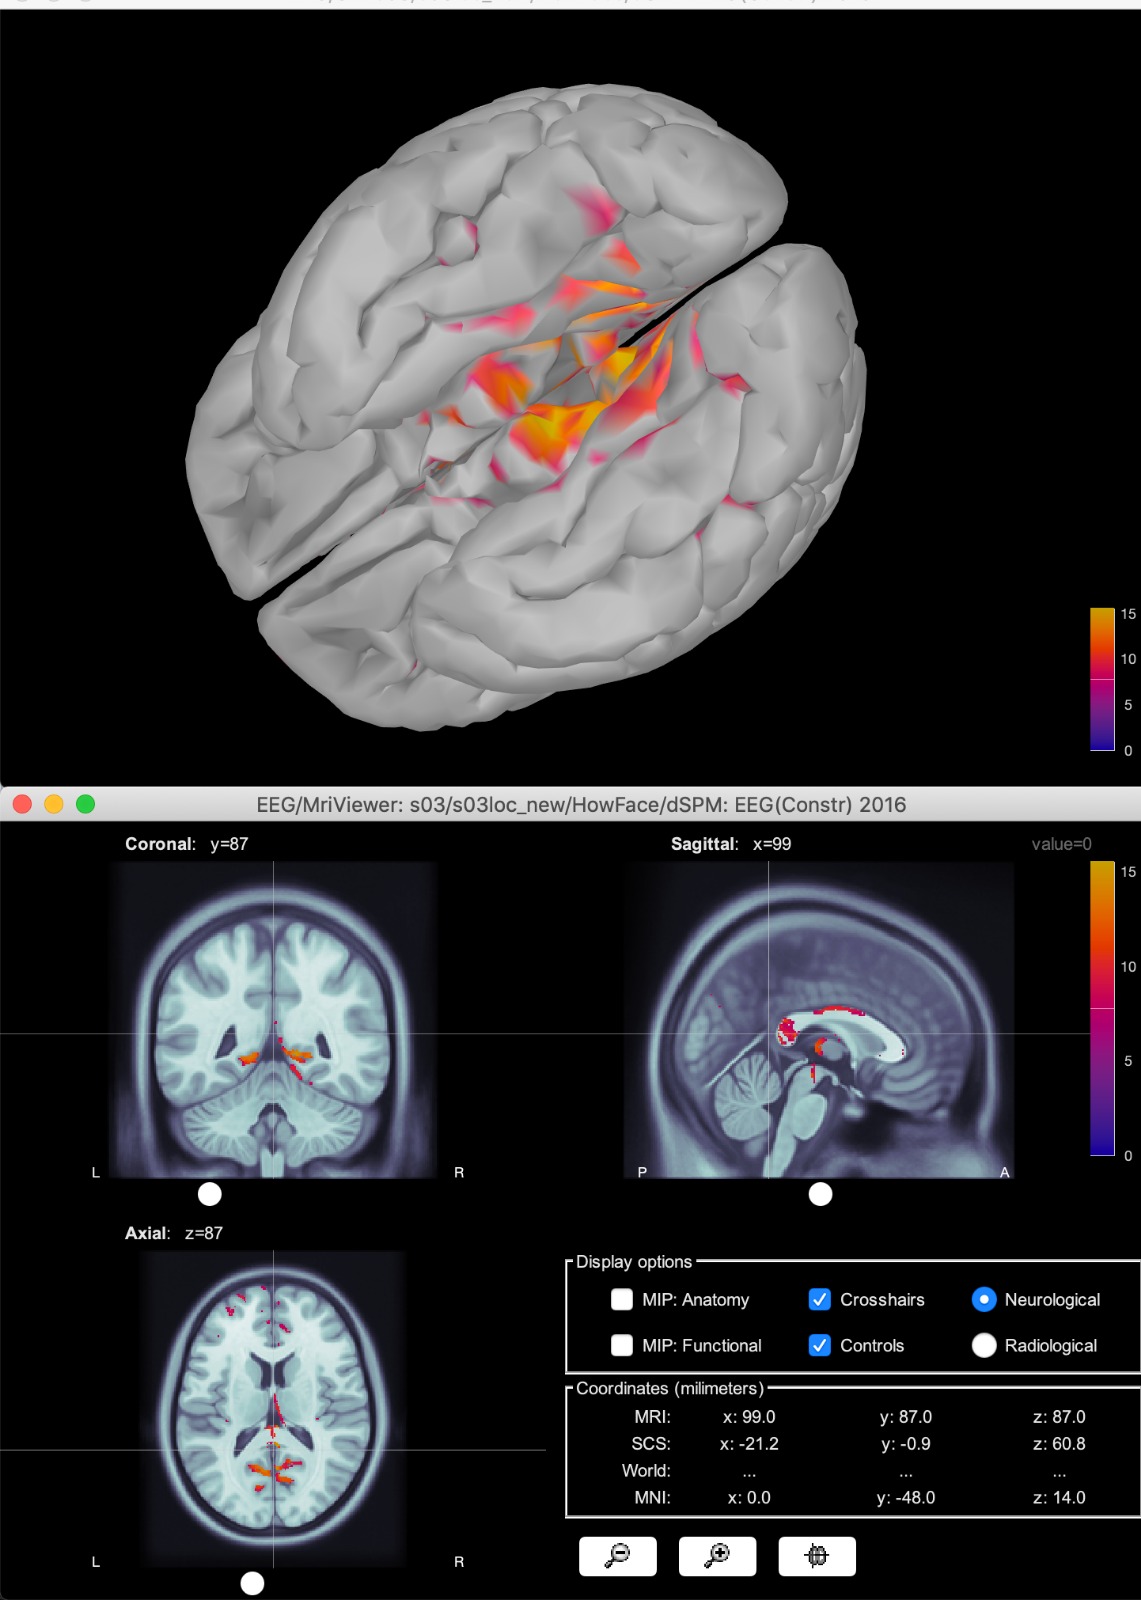
When visualizing source analysis from both sLORETA and dSPM, there appears to be an usual amount of activity localized to the center (and bottom) of the brain (particularly around the brainstem). I see this issue persistently in all the files that I have tried it with, and playing around with any of the parameters does not help.
This is very clean data, that shows clear expected differences in ERPs and time frequency so I am worried that it is a problem with either the parameters that I am using or in brainstorm.
My current approach is as follows:
Import my .erp files (although I see the same results with .set files)
Import the built-in EGI 256 electrode channel file
Use the imported files to compute a noise covariance matrix from -500-0 ms. (**I also tried computing noise covariance files from datasets created with resting state data from the same subjects and get the same end result.)
Compute a head model
Compute sources using dSPM
You can see the steps scripted in the file linked here
It appears to be a problem similar to the one described in this Field Trip tutorial.
Do I need to do a similar correction to the Neural Activity Index (NAI) one described in the above link in Brainstorm? Or do you have any other ideas on how to resolve this issue?
Any pointers in this matter would be greatly appreciated
Could you post screen captures illustrating what you recordings actually look like?
(ERP, topography at latency of interest, noise covariance, position of the electrodes on the head)
Hi the images are quite big but you can see for one subject here and the other one here. Let me know if this is what you need or if anything else can help.
I was also wondering if you have any sample brainstorm validataed data that I could use to see if things are working as they should be on my end?
Hi @Francois just wanted to follow up and see if you have any advice on what could be causing the problems above or if you have any ERP datasets that have been validated that i could try the pipeline out with?
Thanks!
Amna
Hi @Sylvain ,
I posted the images above. Are they ok?
Also I tried to do the same steps in Fieldtrip and got source maps, so I was wondering if this doesnt work out whether or not there is a way to import fieldtrip source data into brainstorm so that I can see the data in the MRI viewer? I can send this to you in an email so you know what the format looks like.
Thanks!
Amna
Hi! This problem always arises when your actual source or two symmetrical sources are near the interhemispheric line. Any algorithms of this kind spread activity over a larger area than the actual source occupies. I suppose that the problem can only be solved by multi-stage prior fitting. Sincerely. Vitaly Verkhlyutov
Looking at the snapshots you posted, I believe the data is still contaminated by eye blinks. You can look at the EEG scalp topography at the time points shown to verify whether there is prominent frontal activity above the eyes.
Hi @Sylvain@vitalyverkhlyutov , I did an ICA to get rid of the eye blinks and the data doesnt look like it has any leftover after all the cleaning. I also did source analysis in fieldtrip using MNE and I get the results I am expecting (however I cant see an MRI viewer using that). The source doesnt also seem to be close to the interhemispheric line in fieldtrip. Do you have any other ideas on what could be happening?
Amna