Hello everyone,
I am working with a dataset of 582 (intracranial) electrodes that looks like this when I import it:
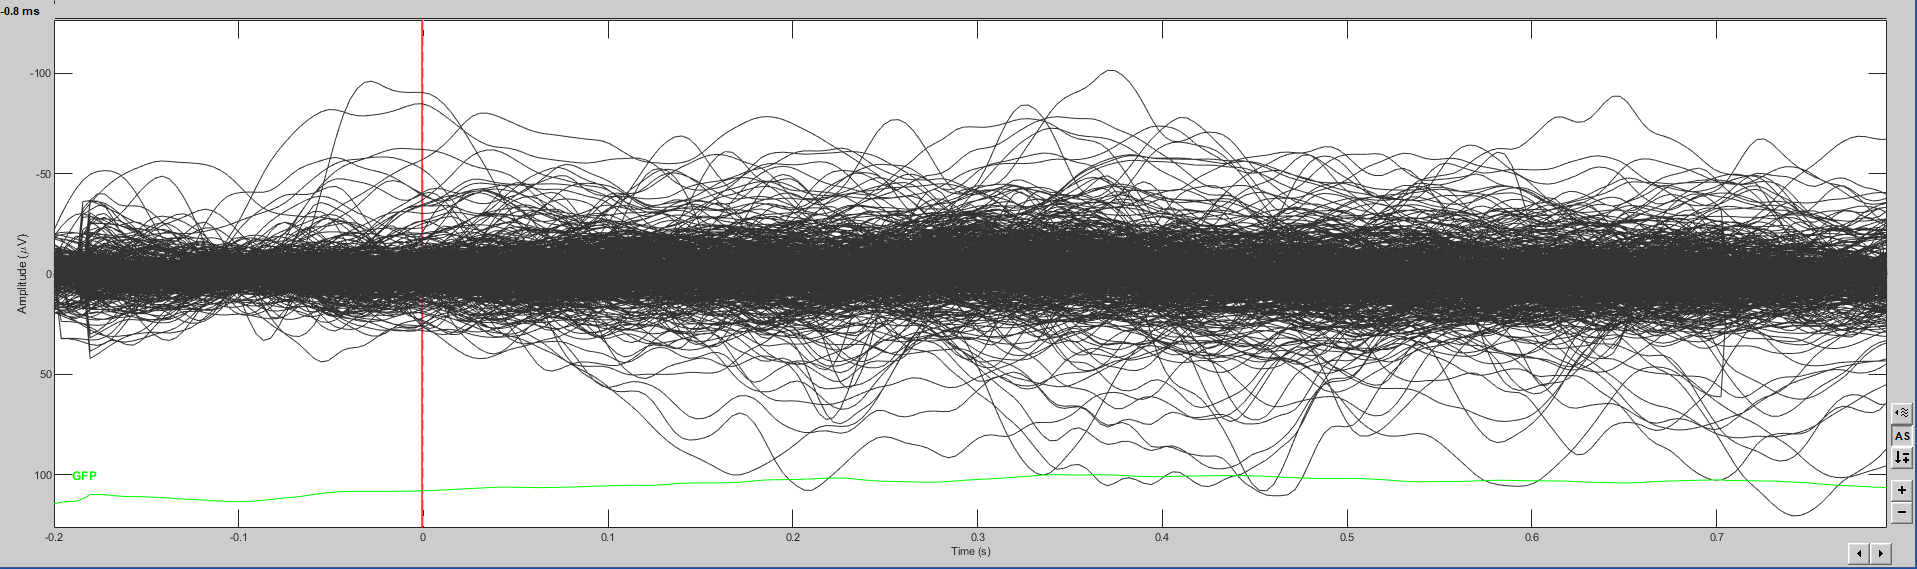
As you can see the unit on the y-axis is µV. I would like to display the voltage map of those waveforms, therefore I need to allocate the location of each electrode (the MNI coordinates are available). However, after I did that, the waveforms are displayed in a different unit on the y-axis and they also look different:
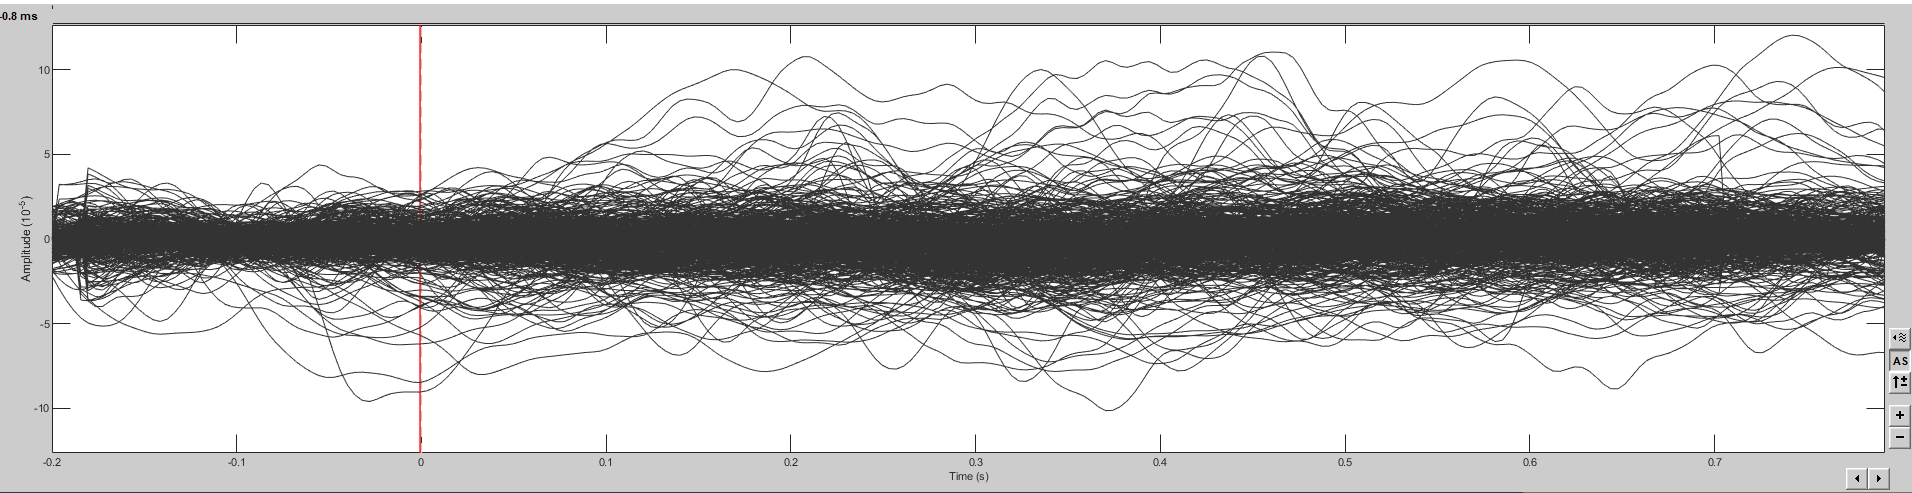
This happens automatically, I haven't changed the settings of the montage.
Does anyone know what happened to the data? How can I look at the waveforms again in µV?
Many thanks for your help!
Kind regards,
Joyce
