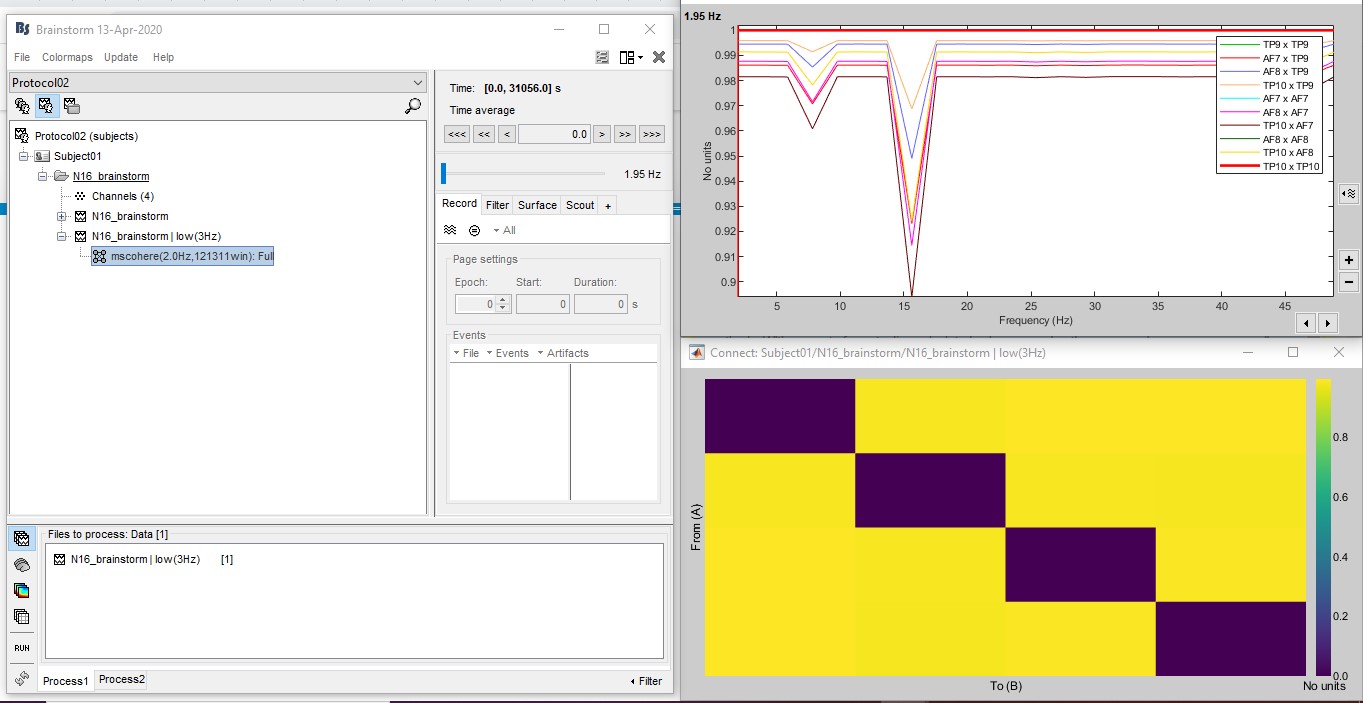
I tried to analyse coherence NxN with muse data in muse.csv file (we just selected column time-stamp, RAWTP9, RAWAF7,RAWAF8, RAWTP10). After, I run data in process, it shown upside down PSD and abnormal plot coherence as attached figure.
What you show here is not necessarily abnormal if all your signals are strongly correlated, especially because you low-passed the signal at 3Hz, which already starts cutting the signal before 3Hz. You probably removed the information you need.
Coherence should be computed from broadband signals, and then explored frequency by frequency.
Please post screen captures of the signals you used to compute these results, the PSD computed over all the recordings, the coherence process options, the position of the electrodes, etc.
You should also update Brainstorm before proceeding, improvements were made to these functions since last April.
I have one question.
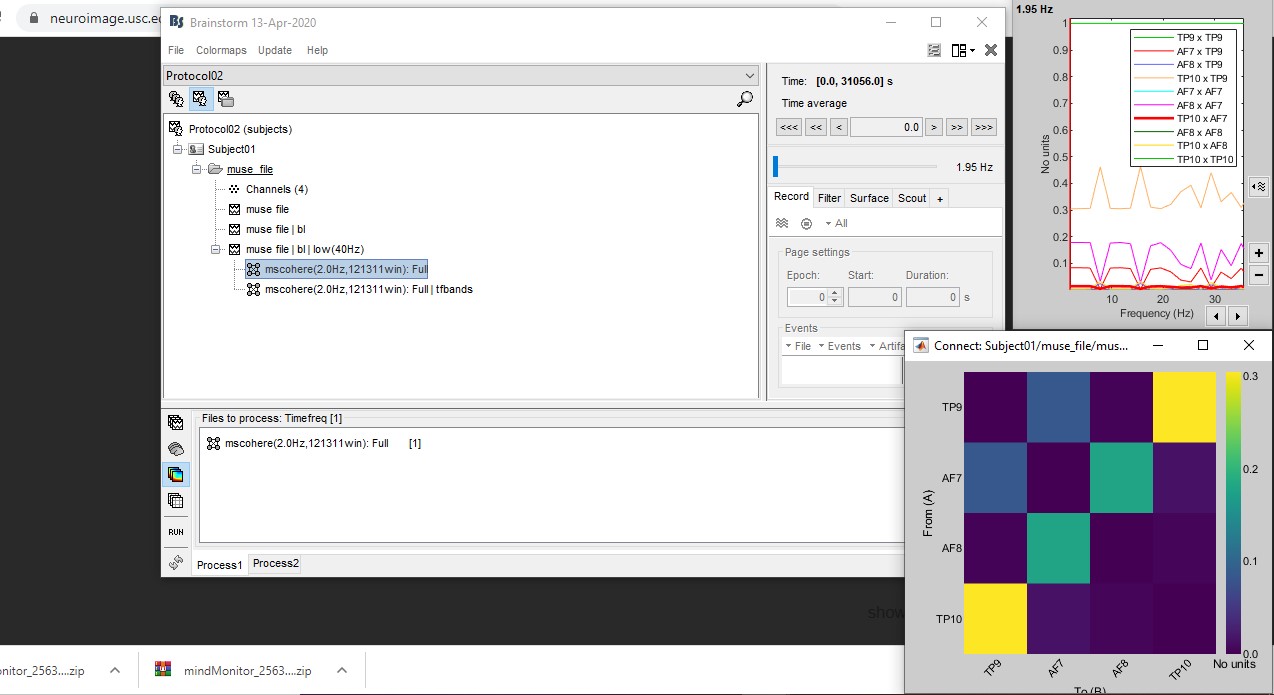
If I want average coherence in frequency band, how should I do?
I try following:
when I got mscohrence in the attached picture. Then, I drag mscoherence in process tap1 and then use the preocess ''Frequency> group by frequency band".
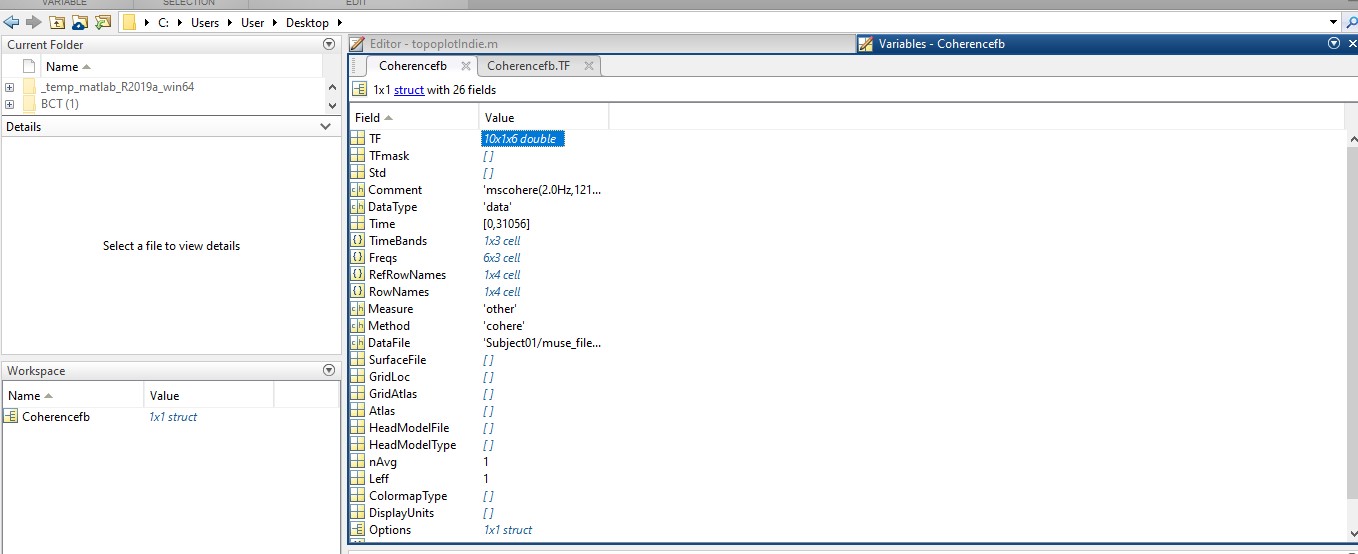
I right click mscoherence:Full I tfbands > export in matlab > save in variable name " Coherencefb"
Click this variable at left bottom in matlab> click variable "TF" (Is it average value of coherence in rage of frequency?)
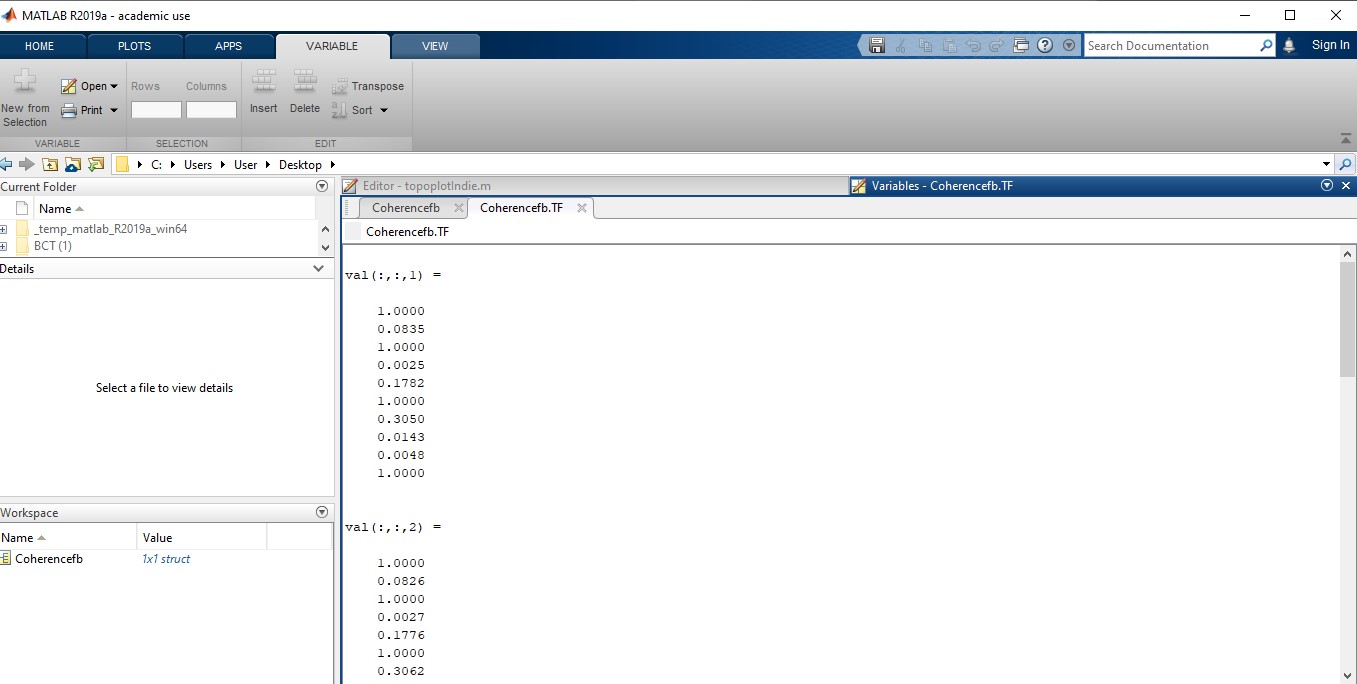
val (:,:,1), val (:,:,2), val(:,:,3), val(:,:4), val(:,:,5), val(:,:,6) are delta, theta, alpha, beta, gamma1, gamma2 ???? And what are value under each val (:,:,12346)????