Hello,
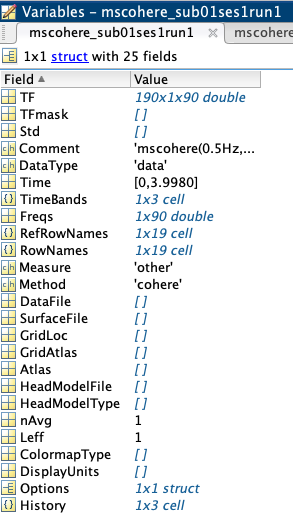
i am calculating a coherence analysis (MScohere NxN) with 30 subjects (2 groups, 2 conditions, each conditions consists out of three runs). Each run has 30 preprocessed epochs with 4 seconds. I calculated Mscohere for each epoch. Is there an option to get the averaged coherence values over the different frequency bands (alpha etc.)? At the moment I can only extract data for every 0,5 Hz. For example, when calculating PLV a clustering in frequency bands is possible.
Thank you very much!
Hi @christinakehm,
Indeed, there is process for this Frequency > Group in time or frequency bands.
- Select Group by frequency bands
- Then input the bands to compute in each row as:
bandName / freq1, freq2 / function
Note: By default Brainstorm uses the cannonical frequency bands (delta, theta, ...). If you change these band definitions, they can be reset with:  > Reset options (more info)
Best,
Raymundo
Hey,
averaging the data by frequency bands was successful, thanks again! To determine group effects I planned to export the data to SPSS. Is there in Option to get the coherence data values in a row? If I export the Data to Excel I get Matrices (similar to a classic correlation matrix), but instead I would need the data in a wide-format (e. g. F4xF4 = x, F4xF3 = y, F4x.....). Is there an option in brainstorm to get the data arranged like this?
Thank you very much in advance.
Greetings
Christina
Is there in Option to get the coherence data values in a row?
The simplest option is maybe to script this.
For example:
ConnectFile = '/.../.../timefreq_connectn_....mat';
ConnectMat = in_bst_timefreq(ConnectFile);
R = bst_memory('GetConnectMatrix', ConnectMat);

for iFreq = 1:size(R,4)
    fid = fopen(sprintf('test-freq%d.txt', iFreq), 'wt');
    for iRow = 1:length(ConnectMat.RefRowNames)
        for iCol = 1:length(ConnectMat.RowNames)
            fprintf(fid, '%sx%s\t%f\n', ConnectMat.RefRowNames{iRow}, ConnectMat.RowNames{iCol}, R(iRow, iCol, 1, iFreq));
        end
    end
    fclose(fid);
end