Hi all,
I would ask you if is it possible to get common source activations across subjects and in particular conditions.
I mean, if I have two different averaged conditions with only a cortical scout commonly activated and other scouts condition-specific, how can I statistically get this?
Hi Giovanni,
I’m not sure I understand what you are trying to do.
Can you give more details about your experiment and your analysis, adding maybe a few screen captures of your database structure or your source maps if it helps?
Thanks,
Francois
Hi Francois,
I have an EEG (128 sensors) dataset with 16 subjects and four conditions (A-B-a-b).
I performed two separated t-test (A vs B and a vs b). The results are two different pattern of activations:
A vs B : l-IPC, l-PMA and SMA;
a vs b: SMA and rDLPFC;
I would like to statistically demonstrate that SMA is the only area commonly activated (a sort of ‘conjunction analysis’ like that used with fMRI data). I hope that my question is clearer now (:!
You mean ‘testing that the SMA is the inly region that is common in the 2 contrasts’? I suppose you could run the same kind of conjunction analysis as in fMRI; it is just not featured in Brainstorm for now. However all Brainstorm results file are in Matlab format and therefore are readily accessible. You may therefore use your own or other Matlab scripts (incl. SPM) to perform the analysis. You amy also indicate a reference where the method you are interested in is described in details and we may advise where to go from there.
Hi Sylvain,
thank you a lot for your response. Yes, I exactly meant what you understood. I’ll try to export the file and to perform additional analyses on spm.
The reference for the conjunction analysis is :
Price CJ, Friston KJ (1997) Cognitive conjunction: a new approach to
brain activation experiments. NeuroImage 5:261–270.
I hope this can help you in planning a possible implementation of a new analysis tool !
Dear BST team,
I have the same request as Giovanni, some years later. I would like to run a conjunction analysis to determine which brain region(s) is/are commonly activated across my two conditions. Is the solution still to use SPM? Thank you for your answer.
Sophie
Hi François,
I found an easy solution using a function found in fieldtrip scripts (see minimumstatistics in ft_conjunctionanalysis).
Thank you for your prompt response!
Best,
Sophie
Yes, I think you're right. But I'm not an expert Here are 2 articles on the subject (Nichol et al. 2005; Friston et al., 2005). According to these two references, I think that a minimum statistical test is sufficient to perform a conjunction analysis.
@pantazis@Sylvain
I could then add a process in Brainstorm that takes in input a set of stat files in the process1 tab, and return a new stat files with the same display options, but with the min tmap and the max pmap across all the files.
Does it make sense?
How should I call this process?
The article "Nichols, T., Brett, M., Andersson, J., Wager, T., Poline, J-B., (2005). Valid conjunction inference with the minimum statistic, NeuroImage, Volume 25, Issue 3." makes the case that we should be using the minimum statistic (or equivalently maximum pvalue) for valid conjunction analysis among several tests. I was familiar with this article and have used the approach in the past. So you got it right, you can implement a min tmap and max pmap across all the conditions to be combined. As for a name, I would call it 'conjunction inference' or 'conjunction inference (with min statistic / max pvalue)'.
I'm currently working on this, and still have one major question regarding the workflow in Brainstorm:
How do we deal with the correction for multiple comparison in this context?
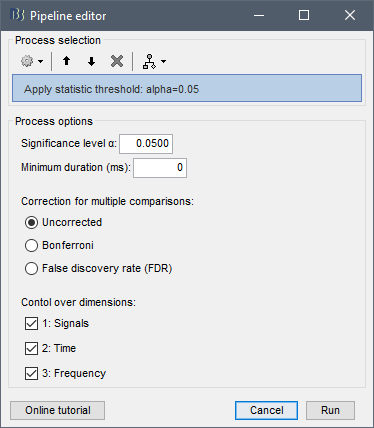
Should I include options in the process to set the type of correction for multiple comparison, compute the corrected p-values for each input file and save in the output file max(corrected_pmap) across all the files?
In that case, the interface would include options similar as the process Apply statistic threshold:
Or is there something smarter I can do to keep the dynamic computation of the correction for multiple comparison from the Stat tab? In that case, what do I do with the multiple .df fields from all the input files?
I find it a bit hard to follow the above, but my understanding from the Nichols paper is that you first apply the conjunction analysis to identify which voxels survive the conjunction requirement, and then apply the multiple comparison correction across voxels. So the operation is more like correction(conjunction) and not conjunction(correction).
I think that by max(corrected_pmap) you mean conjunction(correction), but this is not the way to go. You should apply the conjunction operation and then the multiple comparison process.
One additional detail: In the case of parametric tests, we save the field df in the stat file, and then recompute the pmap values dynamically from the tmap and df values with this function:
In this conjunction process: should I compute the pmap values get rid of the field df in the stat files in input, and then get the max(pmap).
Last question: are there types of stat results I should not allow combining together with this process?
Could this process also be applied across different statistical tests between the same data sets?
As you write, I recommend computing the p-values first, and then applying the conjunction process max(p-values). Discard the df field.
I do not recommend you work with t-statistics for conjunction analysis. You cannot just take the min(t-statistics) because each statistic may have different degrees of freedom, which would result in varying p-values. For example, if tstatistic1=tstatistic2 and df1>df2, then pvalue1<pvalue2.
Regarding your last questions: I cannot see any reason why you cannot combine any stat results in conjunction analysis, as long as you have their pvalues. For two tests A and B, conjunction means A AND B. But A and B can be any logical statements, e.g. (a) you have significant brain activity in frontal lobe AND parietal lobe, or (b) you have significant brain activity in frontal lobe AND desynchronization in gamma-band, etc.
Do you think this is OK if we save the min(tmap) but add a warning in the process options explaining that the output t-statistics are not reliable?
Could you please draft a sentence explaining this that I could add to the process panel?
The correct conjunction approach would be to solely apply the operation:
max(pvalue)
Then keep the t-statistic and its df that corresponds to the max pvalue.
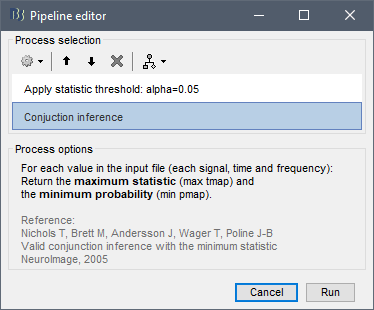
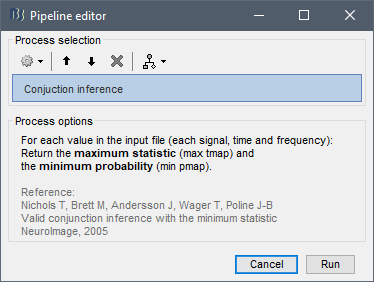
For the process panel, you can write something like:
For each value in the input file (each signal, time, and frequency):
Return the statistic that corresponds to the largest p-value (max pmap).
Note, your screenshots suggest max tmap and min pmap, but it is the other way around. The correct is max pmap and (loosely speaking) min tmap, thought the later should consider the degrees of freedom.
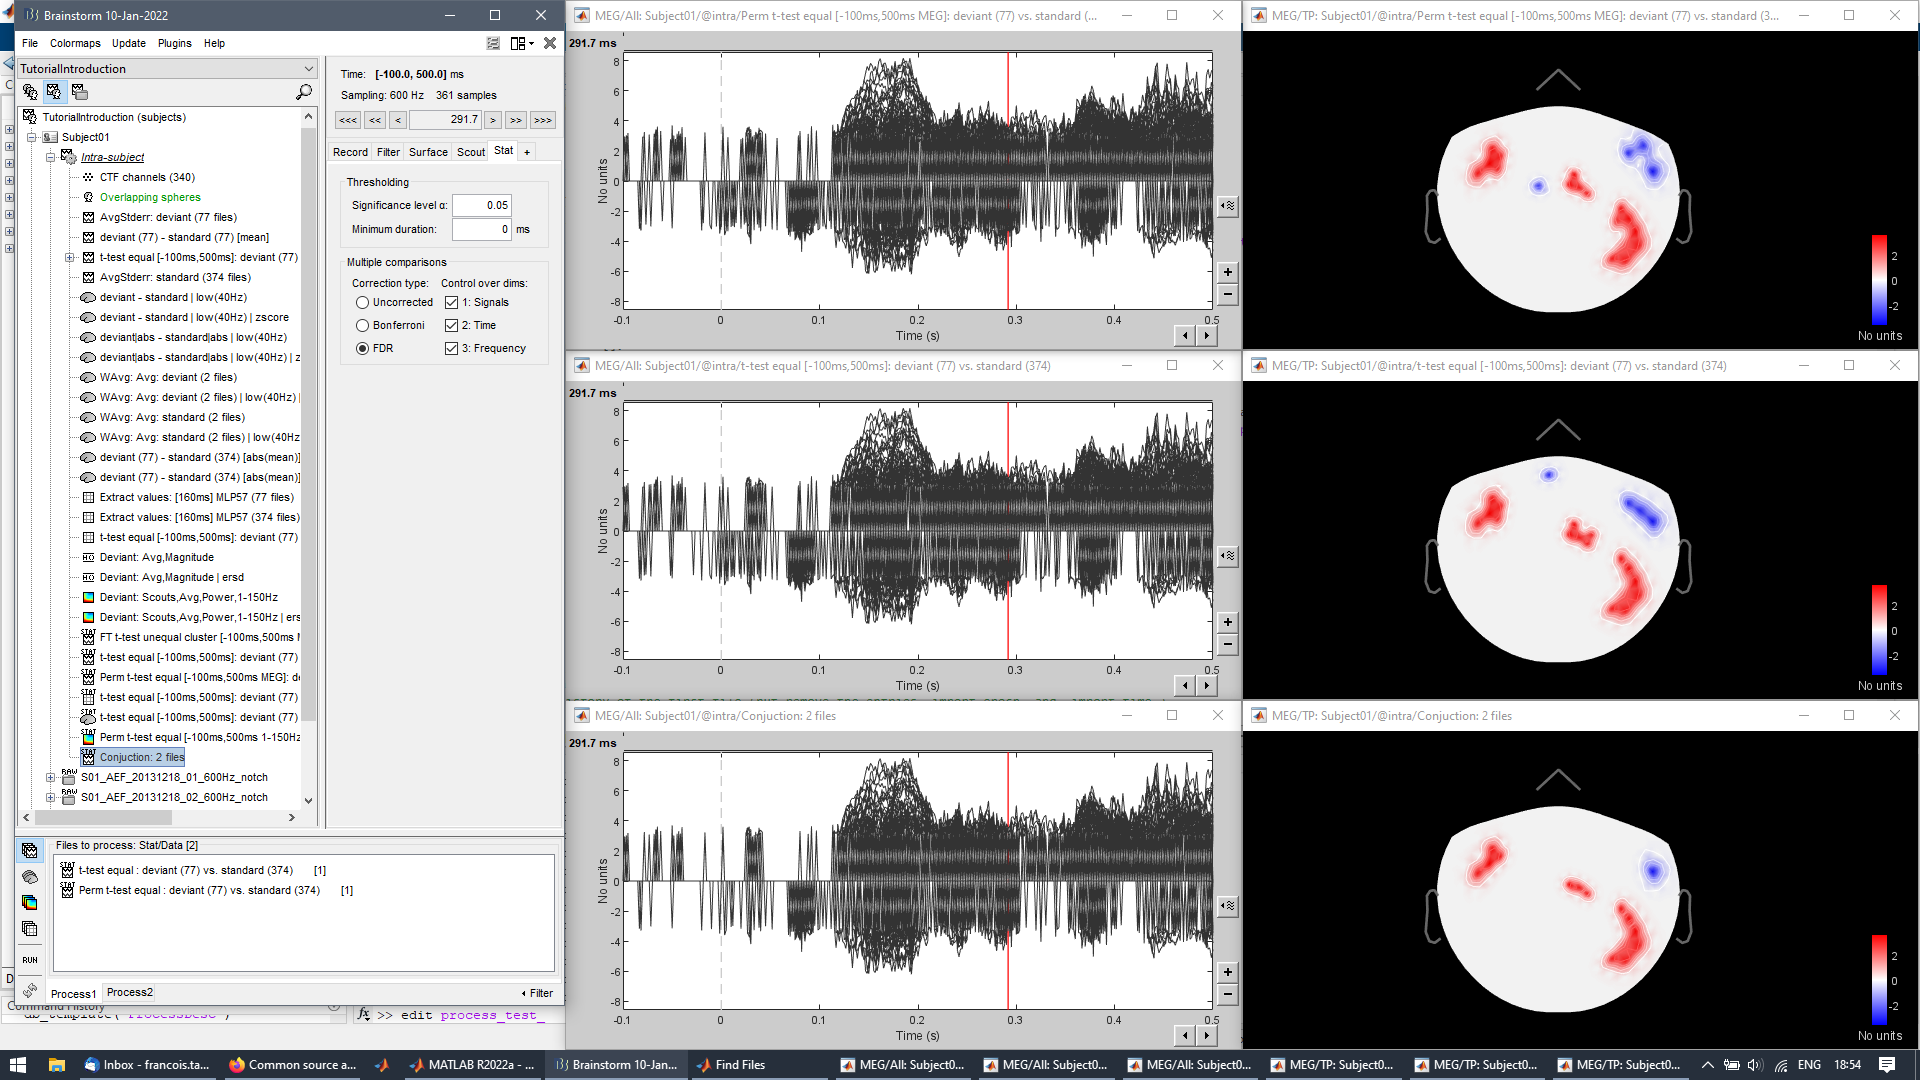
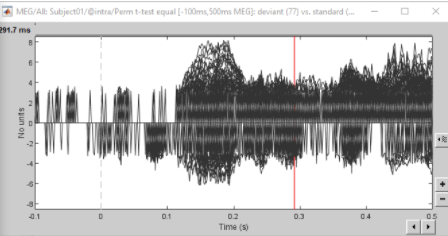
This is unrelated to this topic, so sorry for placing it here. I always felt the plots with significance on time series, like the below, are confusing and difficult to read in Brainstorm:
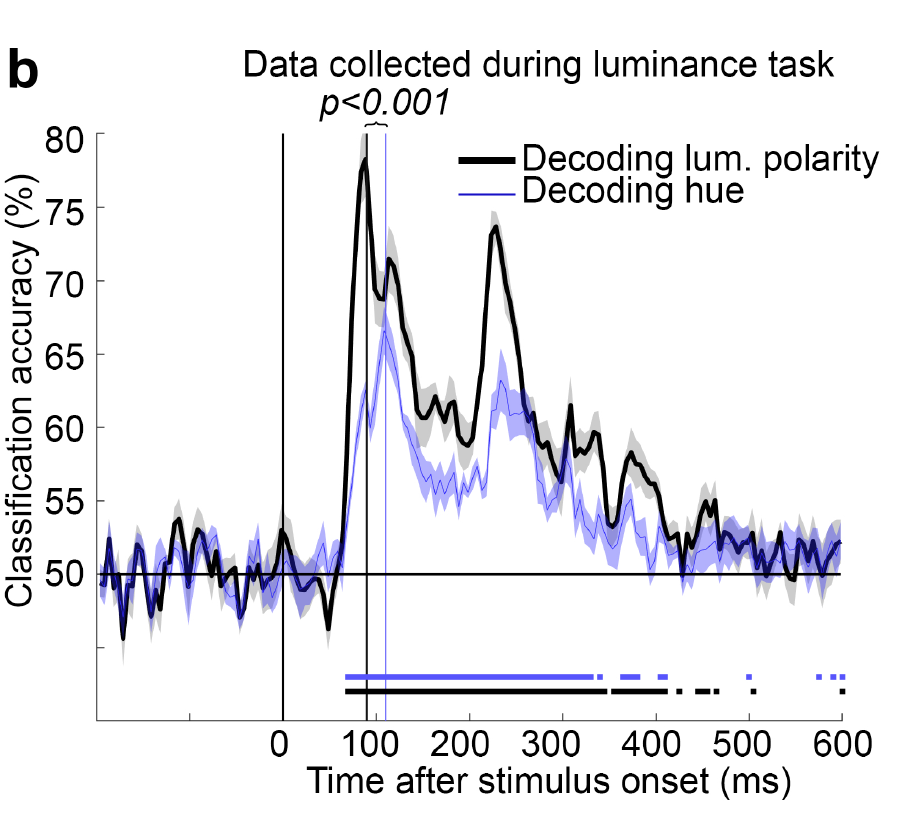
There are other ways to show significance, such as placing a line below the plots indicating where we have significant time points:
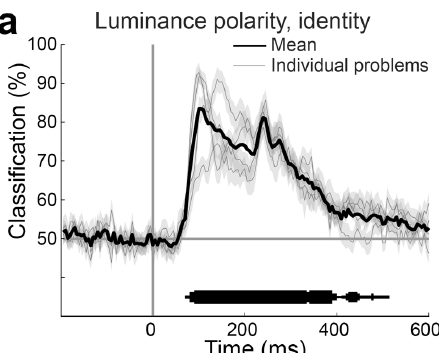
The line can even vary in thickness showing the number of significant tests, etc:
Alternatively, instead of forcing the lines to zero (causing the discontinuities that are difficult to read), you could change the color of the time courses to light gray when not significant.
I understand the above are not straightforward to implement, but this is food for thought. We could perhaps chat about this in the next Brainstorm developer meeting?
 Here are 2 articles on the subject (Nichol et al. 2005; Friston et al., 2005). According to these two references, I think that a minimum statistical test is sufficient to perform a conjunction analysis.