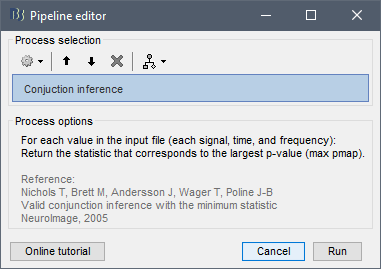
Note, your screenshots suggest max tmap and min pmap, but it is the other way around.
Yes, of course, the text was wrong, the computation correct.
The correct conjunction approach would be to solely apply the operation: max(pvalue)
Then keep the t-statistic and its df that corresponds to the max pvalue.
Thanks, I implemented this in this commit: Statistics: Added process "Conjuction inference" (fix) · brainstorm-tools/brainstorm3@986218d · GitHub
There are other ways to show significance, such as placing a line below the plots indicating where we have significant time points:
This is what is implemented for cluster-based tests, which have only one p-value for all the sensors within a cluster (the colored segments at the top represent the significant time points for each cluster, with the same colors as in the Stat tab):
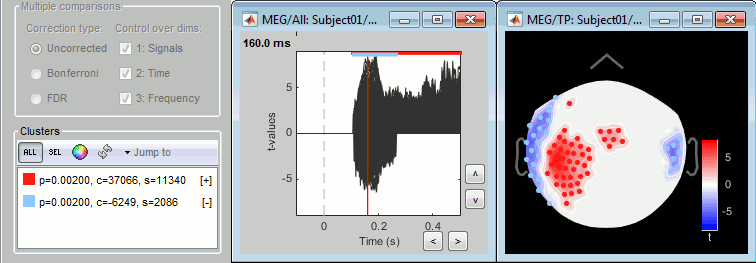
The line can even vary in thickness showing the number of significant tests, etc:
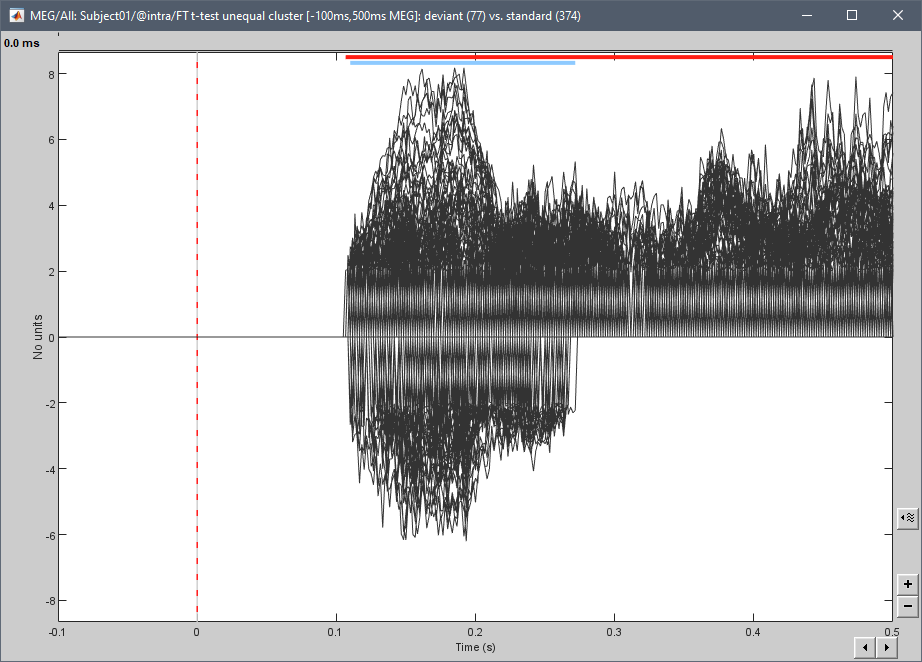
This looks OK in the figure you copied ("luminance polarity"), with 4 repetitions of the same measure. But I don't see how this could be readable with 300 sensors (for which displaying the mean doesn't make sense).
Alternatively, instead of forcing the lines to zero (causing the discontinuities that are difficult to read), you could change the color of the time courses to light gray when not significant.
This would require recoding entirely how the significant values are filtered with the Stat tab and displayed.
We could hide the parts of the lines that go down to zero. But in that case, it would be difficult to represent the isolated time points. I could display the time series as dots (with the Matlab Marker* properties), but then it means dots for all the data points because for the moment each line is one graphical object, and it's not possible to display dots for only a subset of values without all of them. Splitting one line in different objects would require revisiting a significant portion of figure_timeseries.m (5200 lines...).
It's doable but we need to balance the time we'd need to invest in these developments with their benefits (wrt to all the other current developments)