Hi Brainstorm Community,
I have a question regarding Time-Frequency decompositions and scouts. After calculating T-F decompositions (as in the resting omega tutorials), I get the power for different frequency bands. I would like to test for differences between groups (patient vs controls). I would like to use the scout function to test my hypothesis, which is something like this: in the orbitofrontal cortex (this ROI is an example. I will be testing multiple ROIs), patients have higher power in the alpha frequency band, when compared to controls.)
With that in mind, I've tried several things in the past to no avail. Here is a list of failed methods:
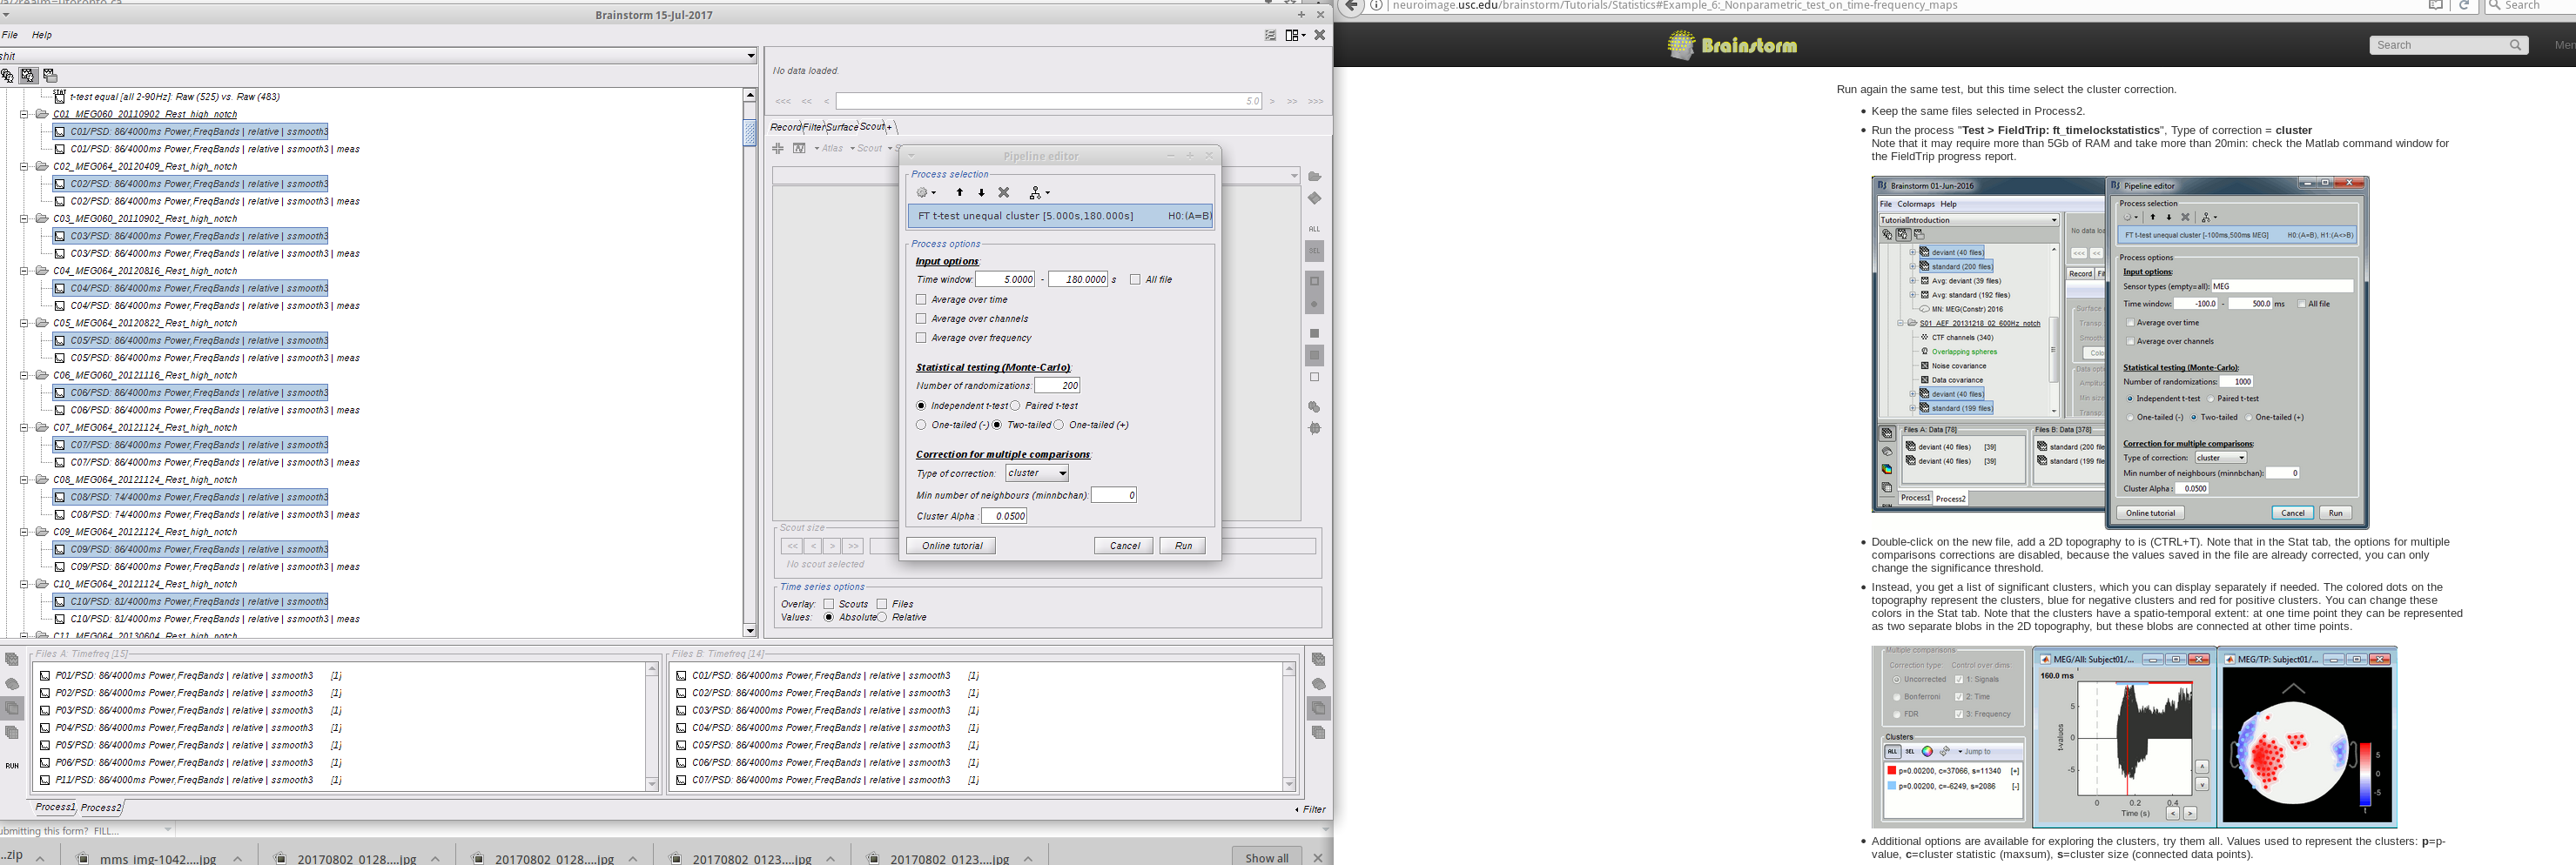
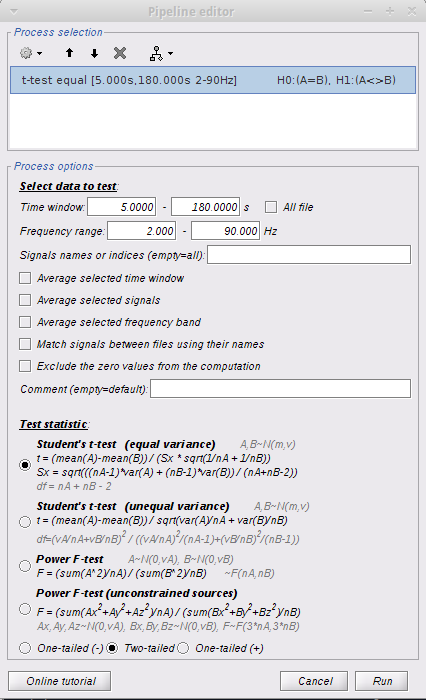
Method 1: I followed the resting omega tutorial and got my TF decompositions on the default anatomy (14 controls and 15 patients). I then computed the average for both groups, and computed a group difference (Test -> Difference (A-B) ). I got a group difference, but then wanted to test for significant regions of interest. I dragged all TF files per group to Process2 tab and ran a Patient-control parametric student's t-test with the following parameters:
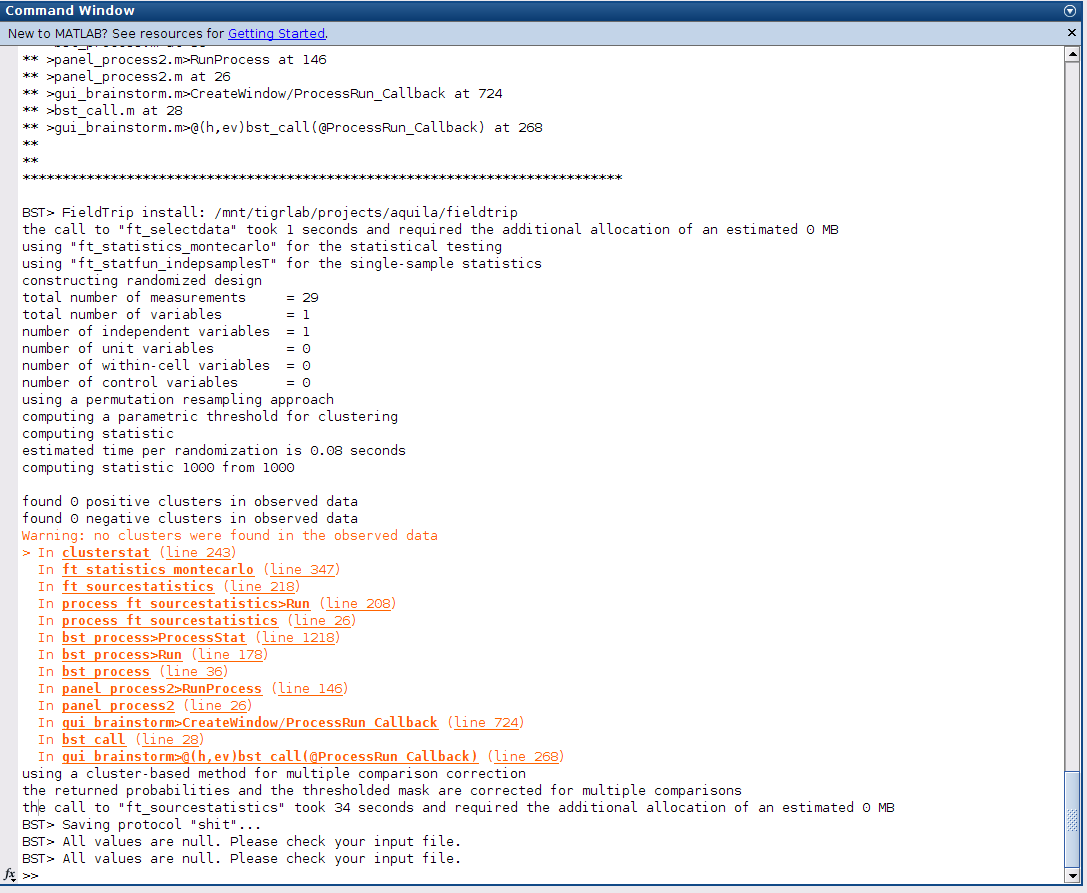
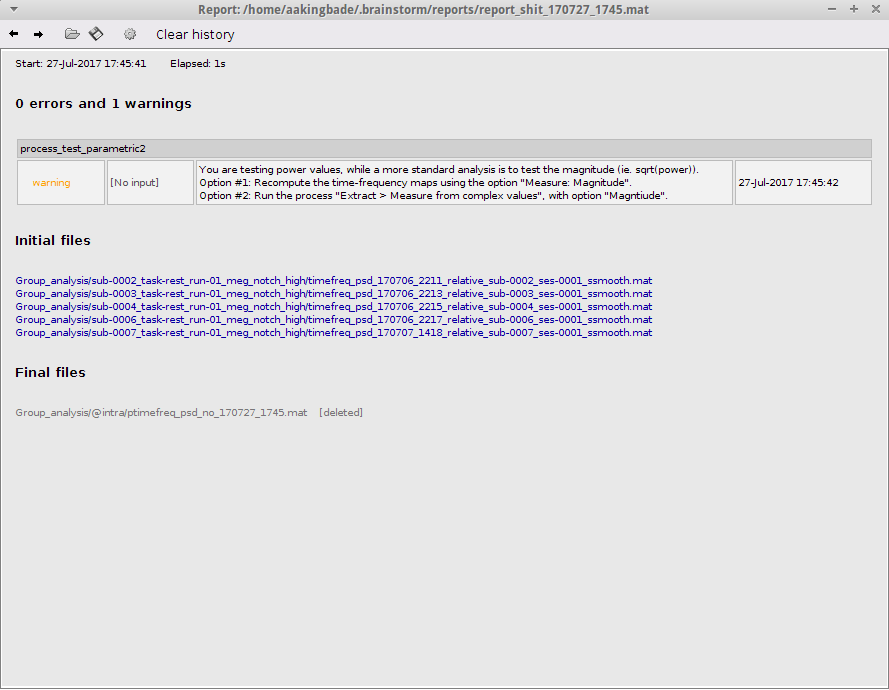
I got the following message (ignore the initial files. I got the same error when I used my data as well):
I followed option two and extracted the measure (Magnitude) from complex values, and tried running the tests again, but this time Matlab gives the following message:
BST> Average corrected p-threshold: 0.0833333 (FDR, Ntests=6)
BST> All values are null. Please check your input file.
I should note that there isn't any indication of activity in the file produced. I went through the tutorial for Statistics, but they are mostly for ERPs (and not resting state) since they deal with time.
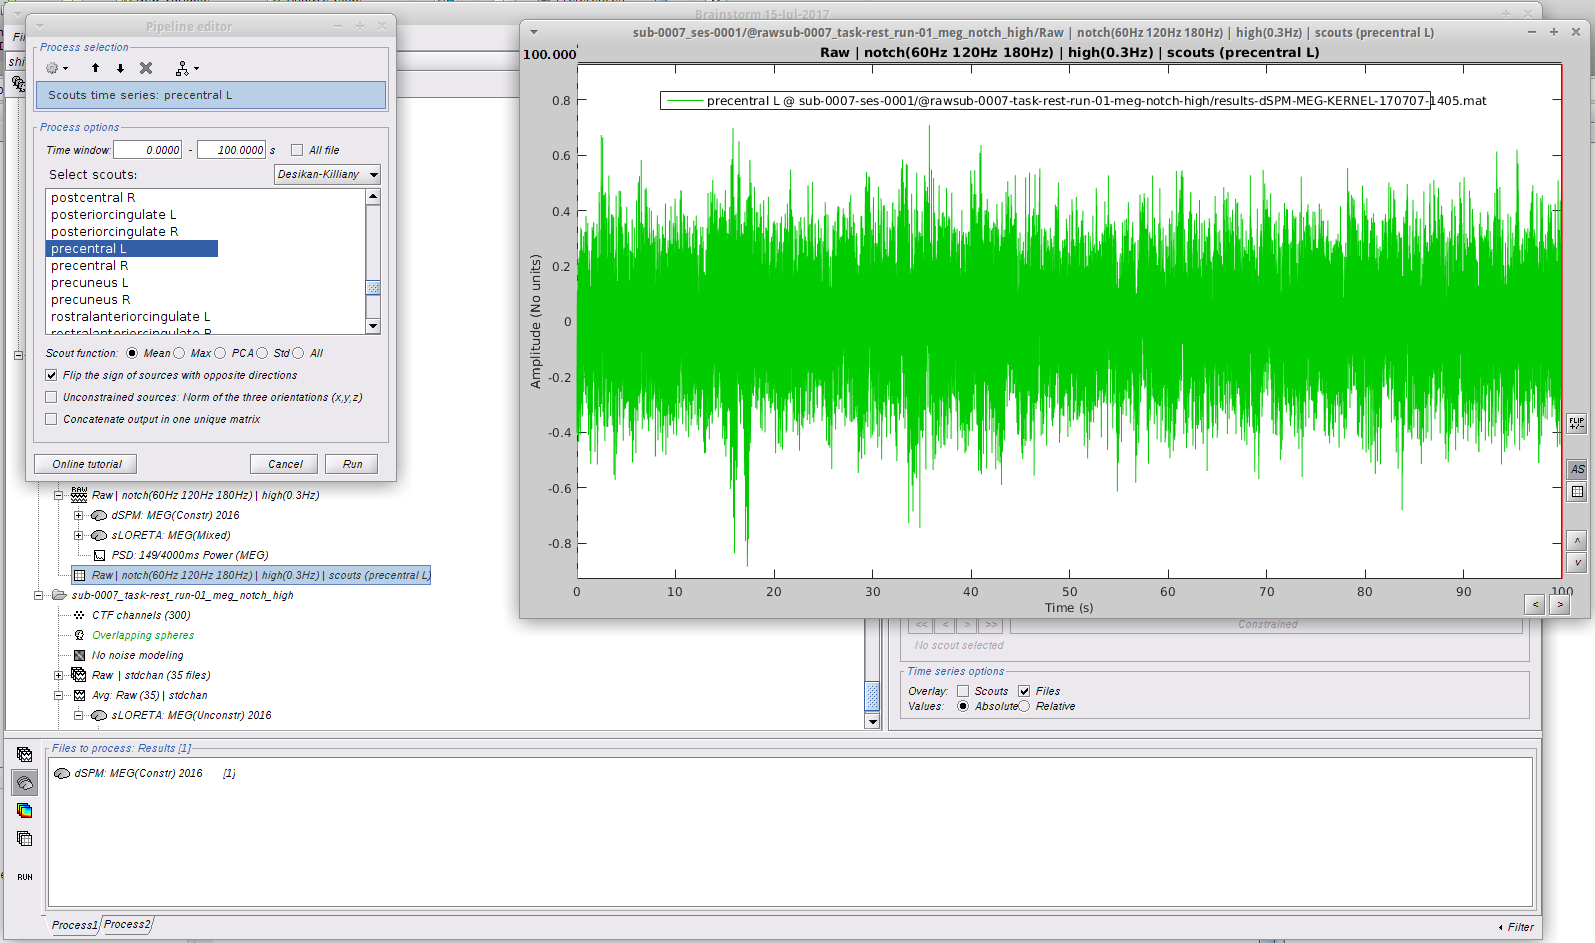
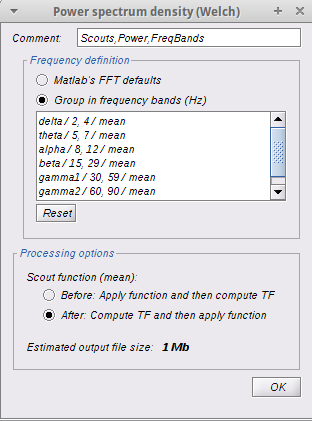
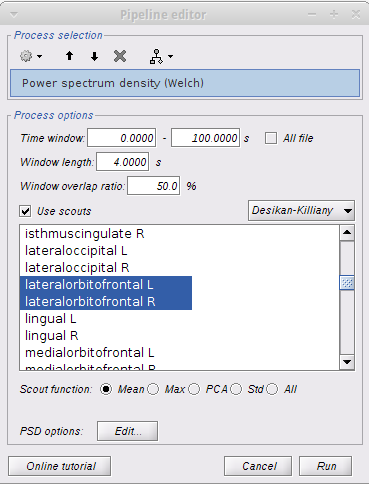
Method 2: I followed the Omega tutorial, but rather than computing brain-wide analysis, I decided to focus on ROIs. I selected 2 scouts on the desikan killiany atlas with the following options:
I immediately got the following error message:
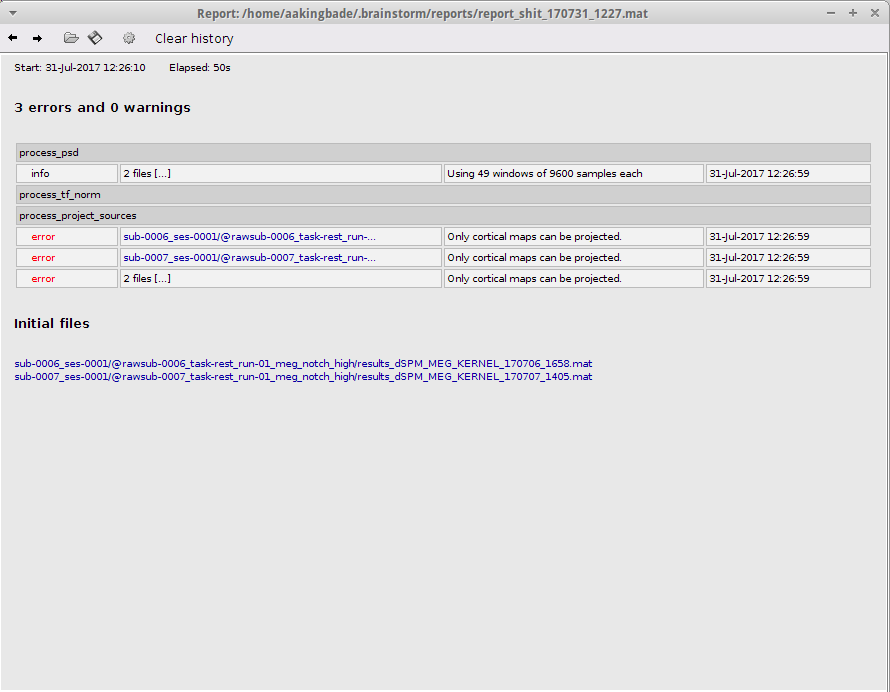
There were files computed in each subjects folder before the process was terminated, but the files were not projected to the default anatomy.
My question is would I still be able to compute Stat tests on the subject without using the standardized anatomy, or are Brainstorm's pre-defined scouts comparable between subjects (thereby negating the need to project to the default anatomy?)
Just to check what might happen if I ran a t-test on the files, I got the same error:
You are testing power values, while a more standard analysis is to test the magnitude (ie. sqrt(power)). Option #1: Recompute the time-frequency maps using the option "Measure: Magnitude". Option #2: Run the process "Extract > Measure from complex values", with option "Magntiude".
I have tried other methods, but for the sake of brevity and time, I'll forgo typing all of them here.
Thank you very much for your help
Best,
Aquila.