Compute (sLORETA+Z-score), (dSPM+Z-score) or (Current density map+Z-score): you should get the exactly same maps (minus some rounding errors)
What you can compare is (sLORETA) vs. (Current density map+Z-score).
Compute (sLORETA+Z-score), (dSPM+Z-score) or (Current density map+Z-score): you should get the exactly same maps (minus some rounding errors)
What you can compare is (sLORETA) vs. (Current density map+Z-score).
Thank you. I found the latter approach to be noisier so sLORETA seems to work better.
I read about an approach in which visual ERPs of interest are modelled through independent component analysis. This was to allow for observation of the spatially fixed and temporally independent components that underlie the ERPs. Once the components that accounted for greatest percent variance in the ERPs of interest the remaining were discarded. They then performed current density reconstruction using sLORETA. The sources were visualized on an average MRI. Is there a way to do this in Brainstorm? I was wondering if this would provide a better way to visualize the ERP in source/MRI space in an image.
Is there a way to do this in Brainstorm?
You can run an ICA decomposition of your signals, keep only one component you are interested in, and then process it as documented in the tutorials. Then repeat that for other IC. Is this what you'd like to do?
I'm not sure what's the validity of running the EEGLAB runica algorithm on an ERP, you'd need to check with the authors of the article your refer to, or with the developers of EEGLAB.
You have to be aware that the hypothesis (one IC = one brain region = one ERP component) is not necessarily correct. One source can be split among multiple IC, and some ERP components do not have any clear anatomical origin (eg. P300). By going into these kinds of analyses, you may need to make assumptions that are not easy to justify, unless you are studying effects that are already well documented.
Thank you. My main analysis was focused on ERPs. For these, I averaged channels within ROIs and across key time windows. I'm trying to create source images to illustrate these ERPs and highlight potential ROIs for future research. I'm trying to get images (preferably a single image per ERP) of the sources.
The difficulty is that the sources have some variance from the ERPs (for example, spatially, the source could be on opposite hemisphere from where significant ERP was located, or, temporally, a significant source may appear slightly later from where the average difference appears largest or the t-value was highest). I'm trying to figure out how best to present this information. I was using the 'difference' between group average cortical maps.
I thought the above approach might reduce some of the spatial variance by filtering out background activity and allow the temporal activity of a source to presented in an image.
Hi Francois,
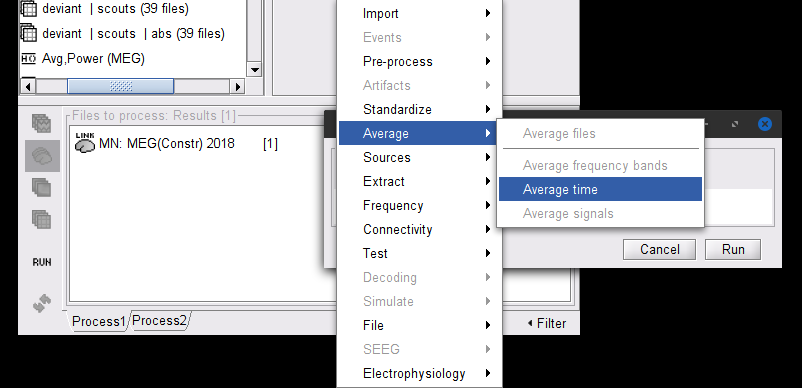
Is there a way to average sources across time in either the cortical map or the MRI viewer? For example if I wanted to view the average source activity across the ERP time window of interest?
Thank you Raymundo
Hi Raymundo,
In this option >Average time, there's an option to calculate the standard deviation instead of the average. Could you advise what this is generally used for? I found that in some instances it seemed to provide a more robust capture of activity over time?
Hi David,
While the standard deviation to get information on how "variable" the magnitude of the source was, the temporal resolution will be lost. In ERPs, the z-score normalization would be more informative, as it will indicate how much the value of the sources at each time point deviates from the baseline average, thus the temporal resolution is kept.
Hi Raymundo,
Thank you. I thought that for sLORETA the normalizations are computed as part of the inverse routine? Should I calculate a z-score normalization for these unconstrained sLORETA maps and then average across the ERP time windows?
That's correct sLORETA is noise-normalized w.r.t. a theoretical data covariance.
If z-score baseline-normalization is applied to sLORETA maps, it should bet the same result as the Current Density map and z-score baseline-normalization, as @Francois mentioned above. This is because the ERP and the baseline were both noise-normalized in the sLORETA case.
In practice, z-scores should not be averaged, as the result is will not be a z-score
Based on the workflow in tutorial 27 to get group differences and what you said, I should use the following pipeline for unconstrained sources?
Compute sources for each individual from the averaged trials
Normalize the individual sources for the averaged trial (z-scores)
Compute the group averages
Either compute the difference between these group averages and then flatten (using norm) OR flatten the group averages and then find the difference (i.e. norm(Zscore(A) - Zscore(B)): or norm(Zscore(A)) - norm(Zscore(B)))
Then average within the ERP time windows of interest e.g. 100-110 ms for the P1 ERP.
Hi Francois,
Could you help with this query?
Thanks
David
This is a possibility, yes.
If you want something simpler, you can use constrained sources.
What do you exactly need help with?
Hi Francois
Thanks. I just wanted to clarify that the pipeline is appropriate.
Hi Francois,
Regards the step below - is the Z-score transform already covered when the subject EEG trials have been corrected for DC offset wrt baseline (after importing epochs and prior to obtaining subject EEG trial averages)?
The two operations do completely different things.
Thanks Francois.