Hi Francois
I am facing some issues
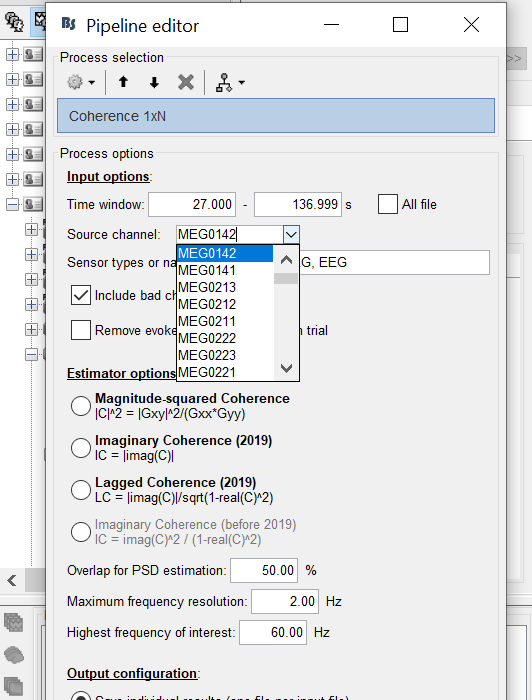
you mentioned: "You can type a list of sensor names in the process options. " It is not possible. It only let me choose one channel at a time
Please check the image:
"And you can always represent the connectivity graph as an image, in which you can zoom, click on the connections to see the actual values"
I click but it shows no value.
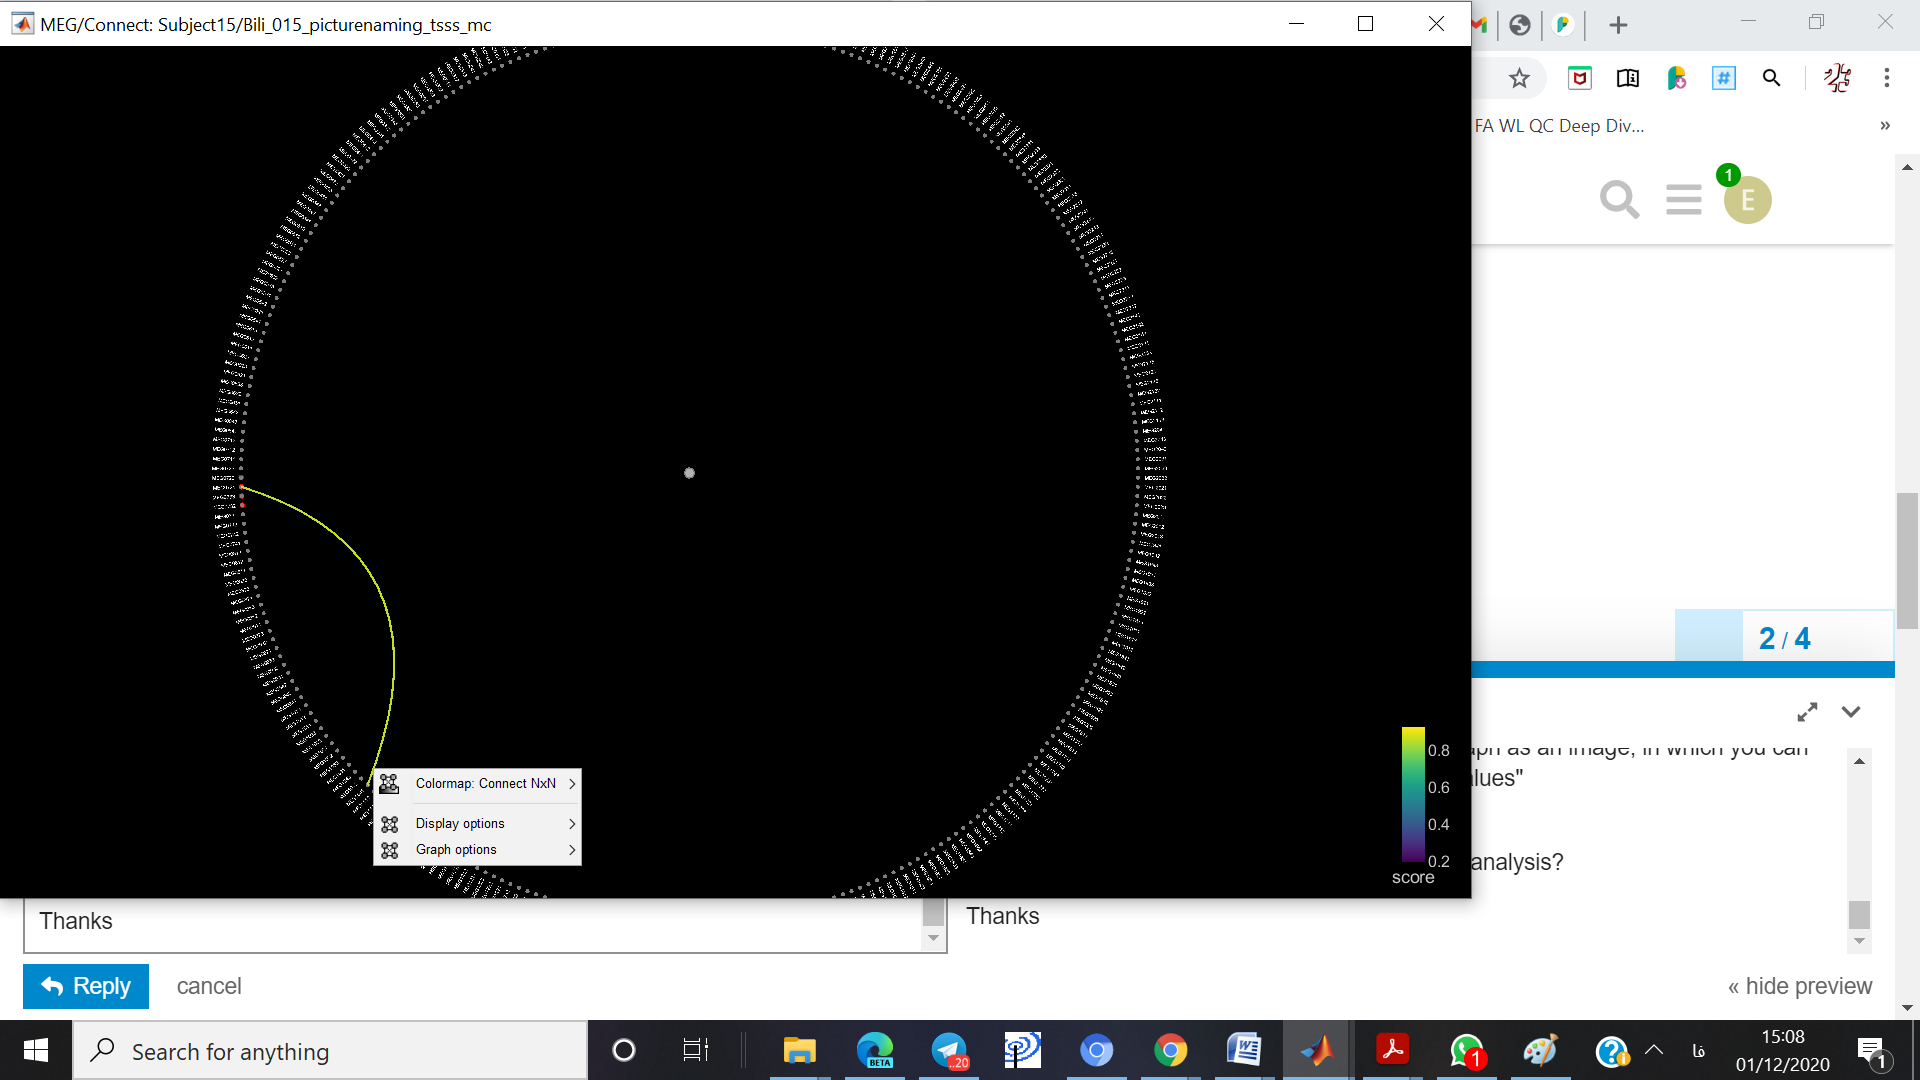
How can I have rho = ?; p = ? values for statistical analysis?
Thanks