In the image MEG channels are mentioned than the ROIs. My questions:
I cannot magnify the image to see the name of channels. How can I use a magnifier or see it larger. As I scroll it only expand the middle of the image and I cannot see the top.
How can I find my region of interest or check which channel is related to which region?
I am using the Brainstorm version of Jan 2020, if I update it, will I lose my data?
I cannot magnify the image to see the name of channels. How can I use a magnifier or see it larger. As I scroll it only expand the middle of the image and I cannot see the top.
Unfortunately, this is not possible. This graph viewer suffers from many limitations and is currently being rewritten by a group of students. Not sure what's the timeline, but we might need a few extra months. @MartinC
One solution is to evaluate the connectivity over less sensors at once.
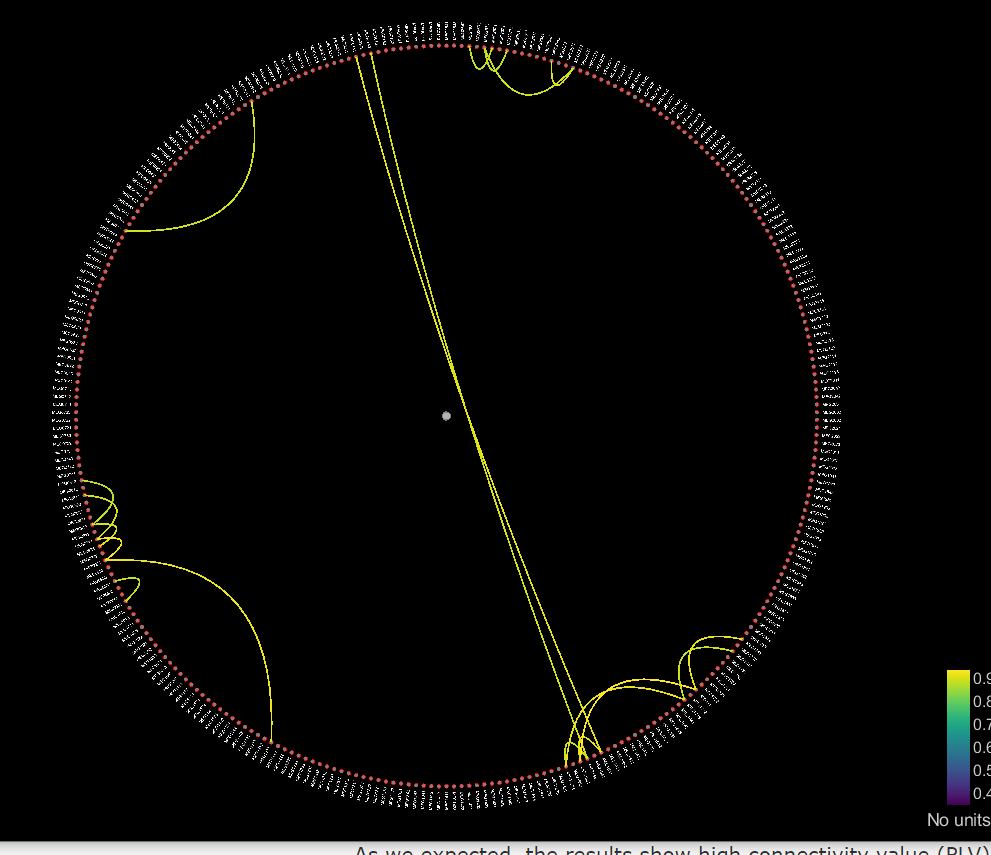
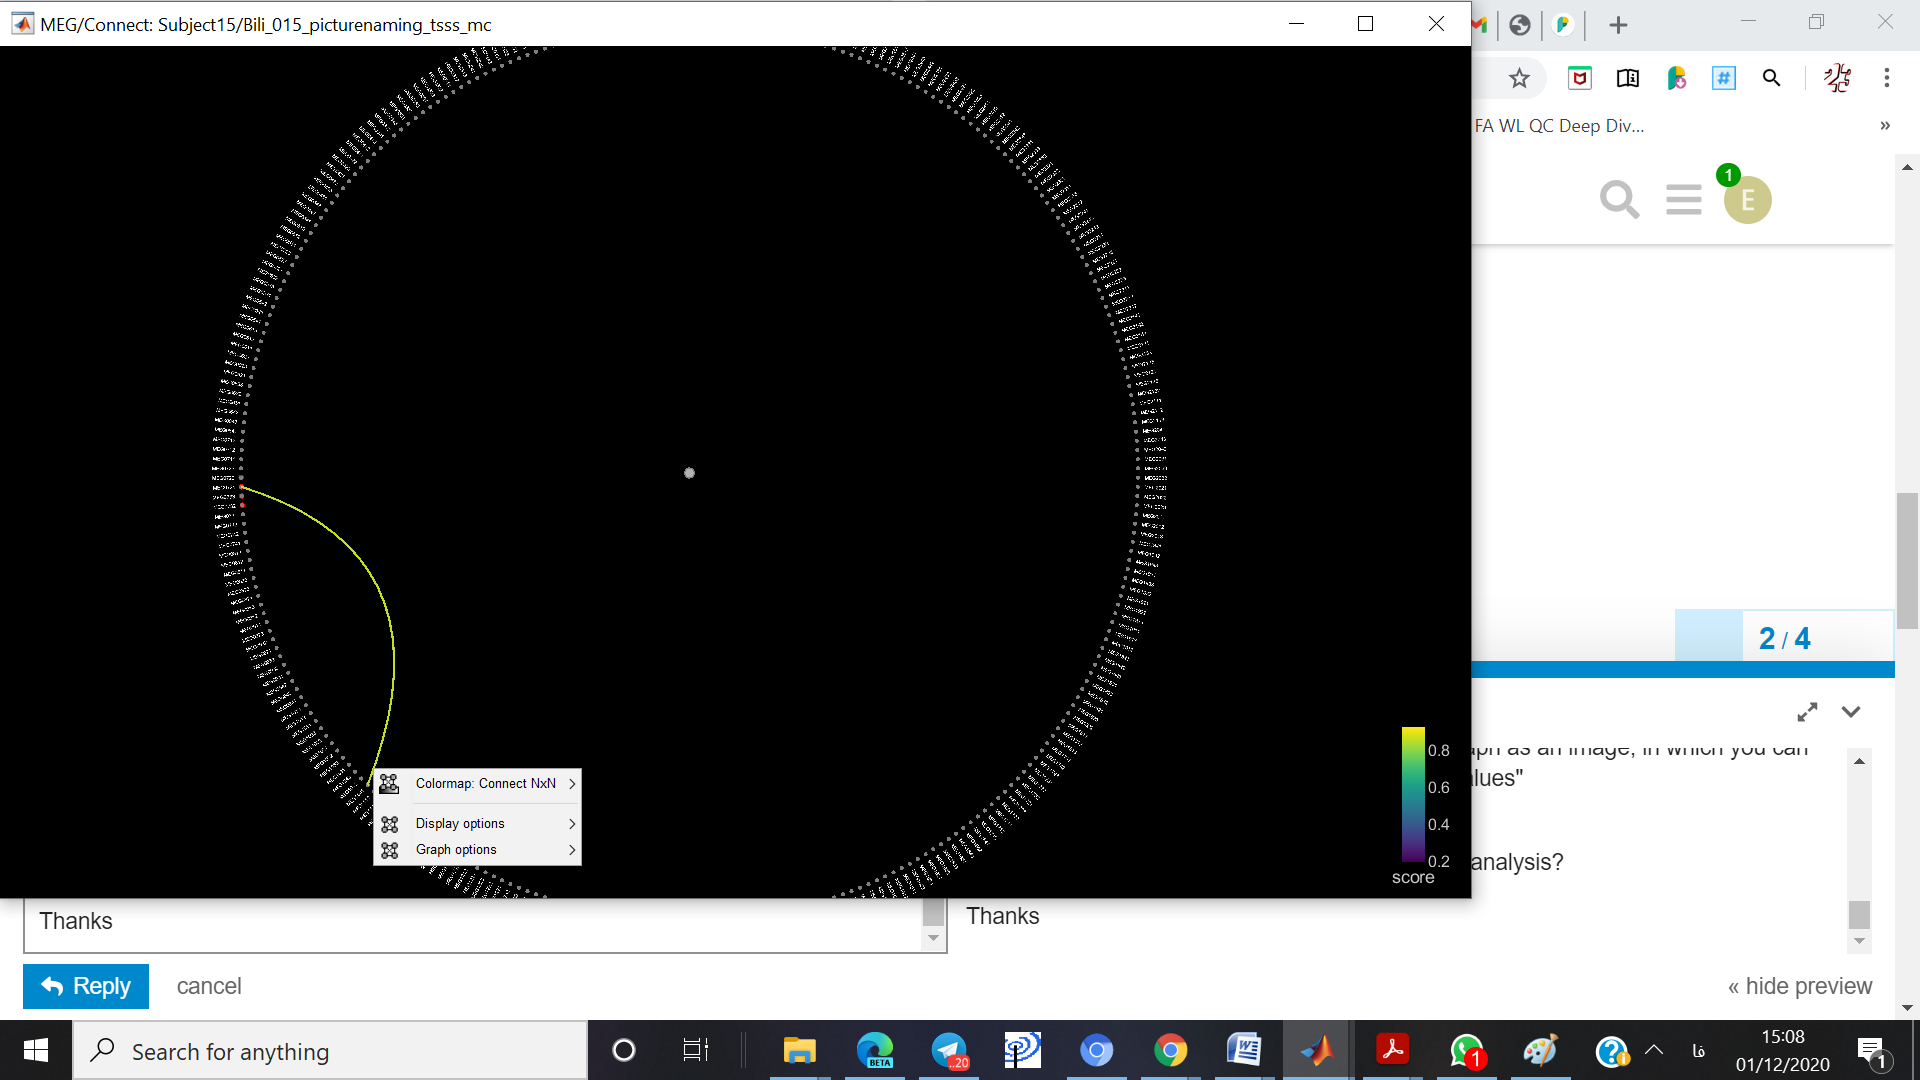
And you can always represent the connectivity graph as an image, in which you can zoom, click on the connections to see the actual values... That display is not as good looking, but actually more readable and more exhaustive.
How can I find my region of interest or check which channel is related to which region?
For the CTF systems, the name of the MEG channels indicate where the are.
For the other systems, you need to refer to a spatial display of the MEG sensors.
You can't related a sensor to a brain region, if this is what you are asking for. Look at the typical topography for a very focal MEG response, the highest field values are recorded away from the location source. One sensor can be involved in recordings the response of brain regions that are not that close.
I am using the Brainstorm version of Jan 2020, if I update it, will I lose my data?
Thanks a lot for your prompt response. How can I chose my regions of interest from the beginning? I went through the steps and I know I can chose Cor 1N instead of NN but now were in the pipe line ask which regions I am interested in? Besides, how can I import an atlas in this stage?
How can I chose my regions of interest from the beginning?
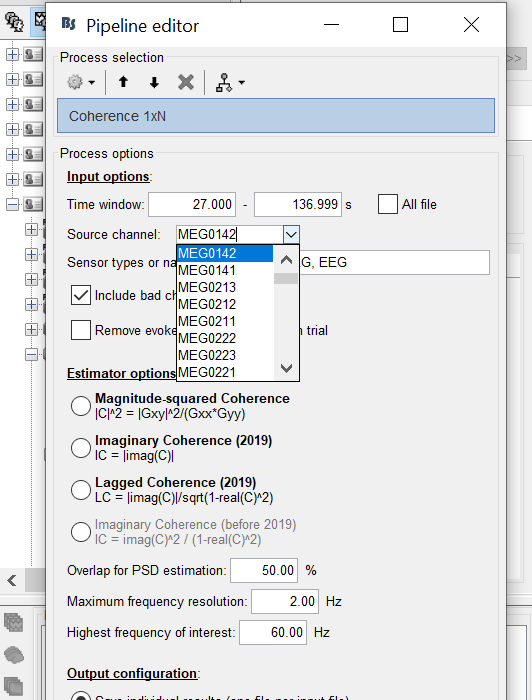
You can type a list of sensor names in the process options.
Besides, how can I import an atlas in this stage?
In sensor space, you do not have any notion of anatomical atlas.
If you haven't followed the introduction tutorials until the end, using the example dataset provide, I recommend you start by doing this before trying to process your own recordings: https://neuroimage.usc.edu/brainstorm/Tutorials
I am facing some issues
you mentioned: "You can type a list of sensor names in the process options. " It is not possible. It only let me choose one channel at a time
Please check the image:
"And you can always represent the connectivity graph as an image, in which you can zoom, click on the connections to see the actual values"
I click but it shows no value.