Hi all,
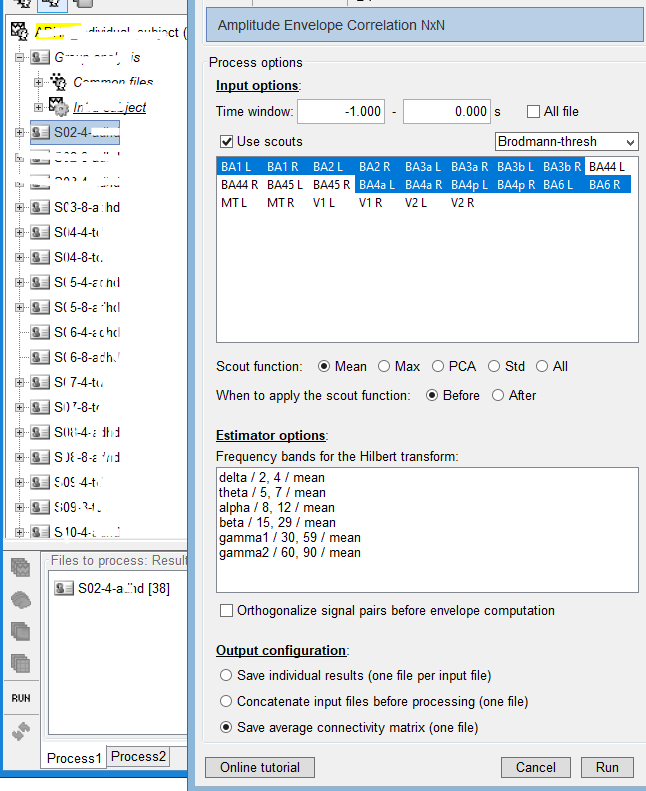
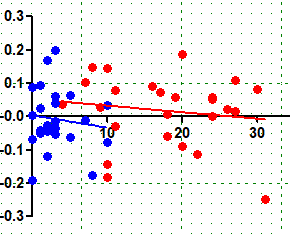
when I used AEC to analyze source functional connectivity (top figure), I first computed a baseline connectivity matrix (time window: -1.000 to 0), then I computed a task connectivity matrix (time window: 1.5 to 3). After that, I got a task_Minus_baseline connectivity (task — baseline), however, the task_Minus_baseline connectivity matrix has both positive and negative values (bottom figure, y axis refers to connectivity). I know that means decreased or increased connectivity when comparing task and baseline. Cold you please me whether my analysis is correct or not? Is the connectivity distribution normal? Thanks a lot!