I am trying to conduct an ROI -to-voxel imaginary coherency (1 x N) functional connectivity analysis, and was hoping for some input for 1) my workflow and 2) this error that I run into.
After going through the standard steps of getting the source (based on the averaged EEG file) for each subject, I then:
projected each source to the default anatomy
created a right DLPFC scout
conduct a coherence (1 x N) using my scout, with my time window defined as 0 - 999 ms (I have a prestimulation baseline period of 1ms, should that be included as well in this step?), scout function as 'mean', when to apply the scout function as 'before', and my estimator options as 'imaginary', maximum frequency resolution of 2 Hz, and high frequency of interest being 20 Hz.
I then spatially smooth each participants iCoh file with a 6 mm kernel
I then put my subjects into their respective groups in process2, select ft_sourcestatistics, put my time window as '0 to 500 ms' (this is based off my sensor level findings), scout function as 'mean', and standard statistical parameters.
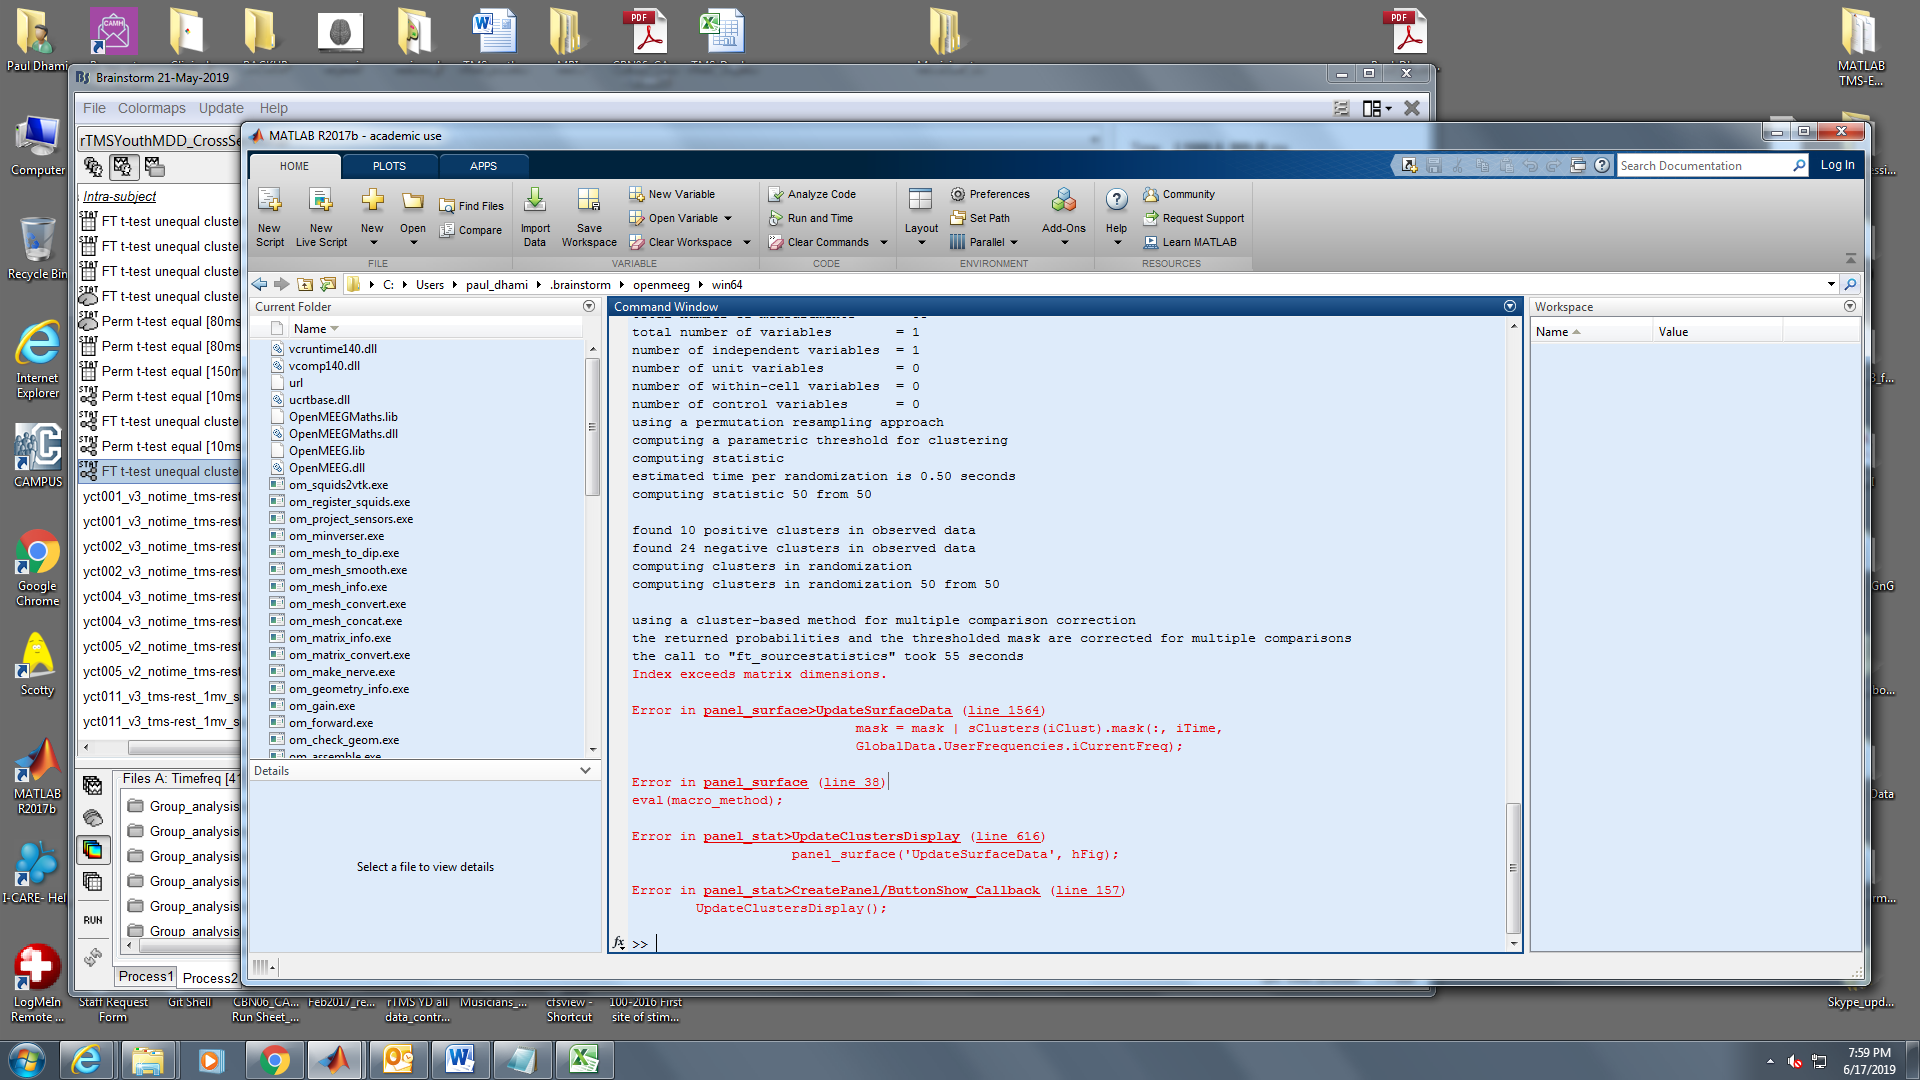
When selecting to 'display on cortex' the resulting stat file, I get this error below:
About your pipeline:
I don't think this is a good idea to estimate coherence from an average. You need long recordings to estimate properly the coherence (either continuous or epoched recordings) and you need the recordings where the frequency contents of the signals is not altered (no averages).
About your error:
I didn't even think computing this file would work... I thought this ft_sourcestatistics function was not equipped to process results of connectivity analysis.
If you send me your final result, I could try to make the display work, but I have no idea of the validity (technical or theoretical) of the sequence of processing steps you used.
If you want to send me your file:
Right-click on the subject folder > File > Duplicate subject
In the duplicated subject, delete all the files that are not necessary to reproduce the error. Keep the MRI, the selected surfaces (in green), the channel files, the forward and inverse models you used, and the file you want to display.
Right-click on the duplicated subject > File > Export subject
Upload the .zip file somewhere (dropbox, google drive...) and post the download link here
With regards to the workflow, could you please explain how to get the cortical sources? It was my initial thought that I would use all the imported EEG trials to calculate coherence, and then project this, but it looks like you cannot project the resulting EEG/sensor iCOH file. Would you have to calculate the source of each individual trial, and then use those source files for coherence analysis?
Also, if I'm using a self-made scout based on MNI coordinates, would it be best to first do some transformation to create a scout on each individual's anatomy and then project, or to first project (each source file from each trial from each subject...) to the default anatomy and then create my scout?
It was my initial thought that I would use all the imported EEG trials to calculate coherence
Yes, this is what you should do. Process the individual trials, not the average.
and then project this, but it looks like you cannot project the resulting EEG/sensor iCOH file
Would you have to calculate the source of each individual trial, and then use those source files for coherence analysis?
Also, if I'm using a self-made scout based on MNI coordinates, would it be best to first do some transformation to create a scout on each individual's anatomy and then project, or to first project (each source file from each trial from each subject...) to the default anatomy and then create my scout?
The most automatic solution is to create the scout on the default anatomy, and project it on all the subjects (tab Scout, menu Scout > Project to...)
Is there any other way to project the scout to each individual anatomy, possible through a 'process'? I am running into the issue of the pop up menu from the scout > project subject list being too long to scroll through all my subjects.
Admittedly, there may be an easy solution to this menu issue, but I'm a bit lost at the moment with how to use bst_project_sources.
EDIT - I was able to manually project the scout to each participant's cortex. After:
computing source on the 'OpenMEEG BEM' file for each subject, thus getting a source file for each trial in each participant
running the imaginary coherency between my entire epoch time (-1000 to 999 ms), with a frequency resolution of 2 Hz and a maximum frequency of 20 Hz, and with the option selected 'concatenate input files before processing',
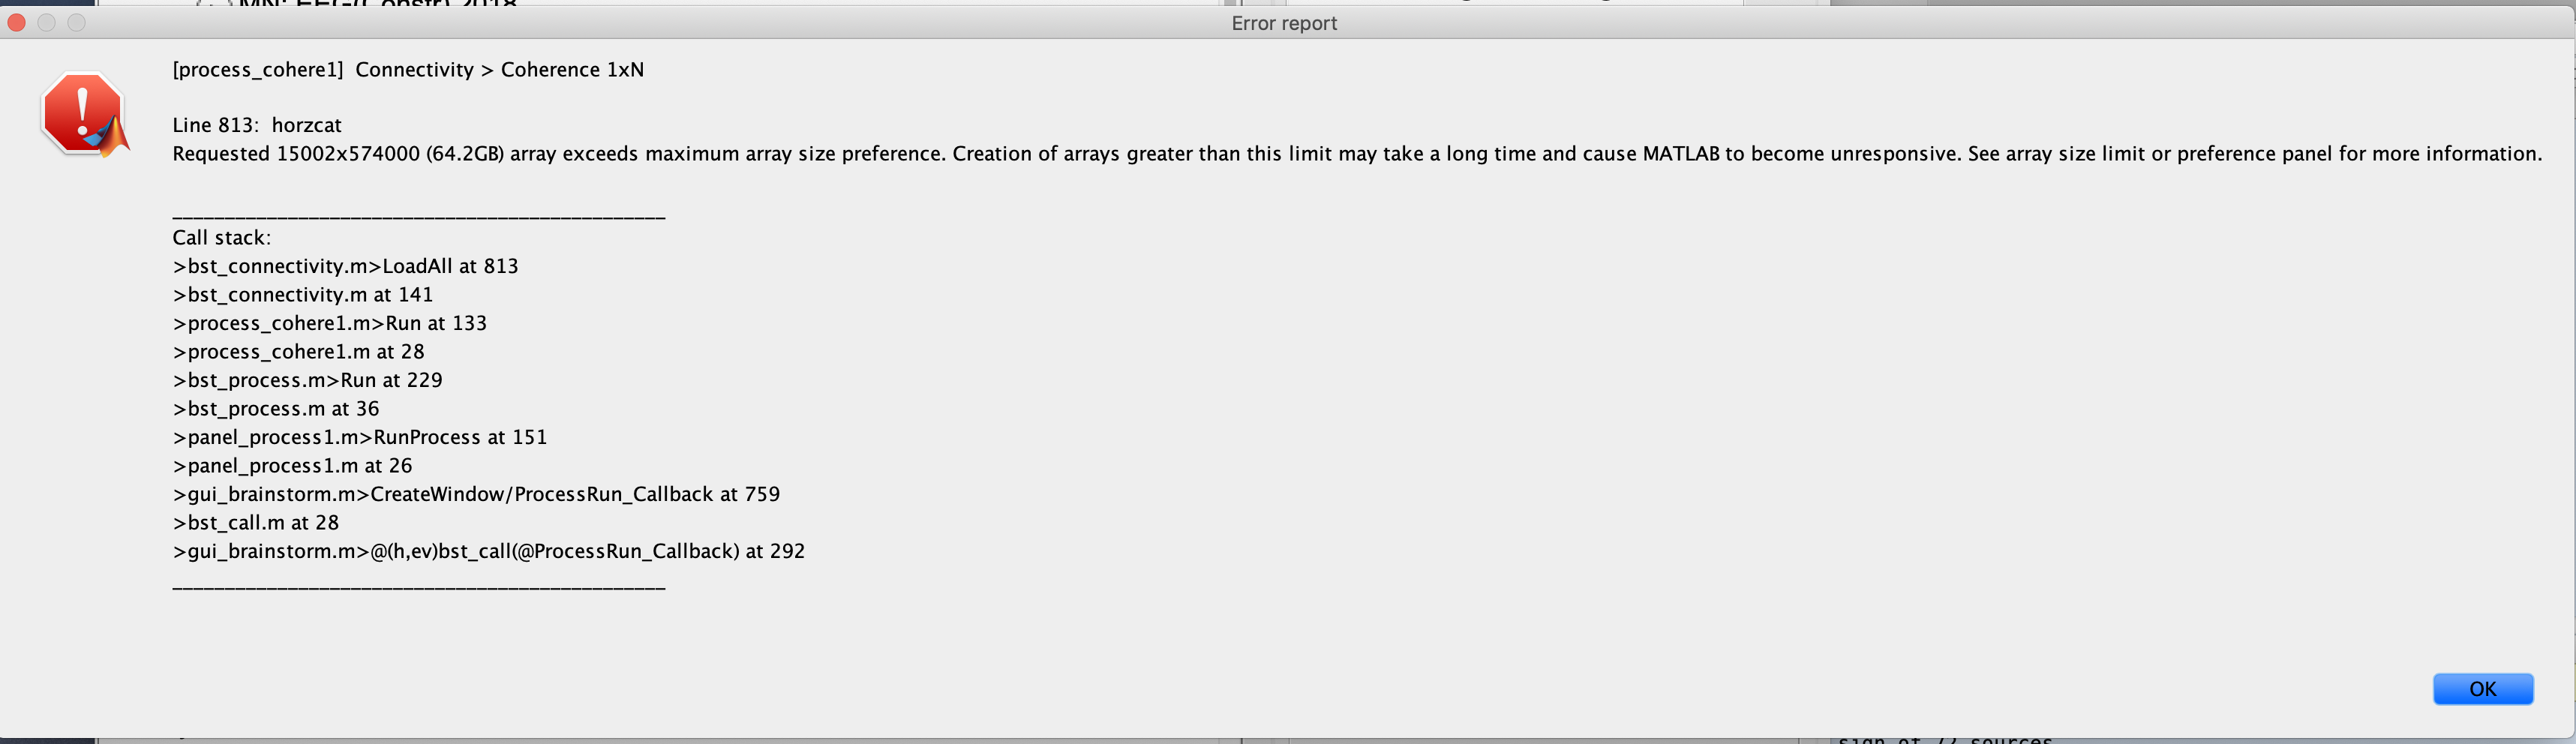
The 'load input files...' is slowing down my entire computer, and eventually I get the error of the resulting array/matrix (~65 GB) being too big.
Would that be the complete space I need to complete my coherency analysis? Is this to be expected for coherency analyses on sources? Is my analysis simply not feasible or am I doing something wrong?
The 'load input files...' is slowing down my entire computer, and eventually I get the error of the resulting array/matrix (~65 GB) being too big.
This is another problem... Indeed, this option "concatenate input files before processing" loads all the recordings (number of sensors x total number of time samples), builds on the fly the source time series (15000 x time samples) and then calls the coherence function on this full matrix. If you work with the full resolution of the cortex surfaces, this will never fit in memory...
You will need to find a way to reduce the dimensions of your problem. For example: decrease the number of vertices, work with ROIs instead of the full brain maps, subdivide your trials in various blocks and then average the coherence values...
Would you be able to share how to do a self made scout to ROI approach in stead of the ROI to all vertices? I'm assuming this would decrease the spatial dimension from 15002 to the number of ROIs in whatever atlas I'm using?
For example, if I'm only interested in the connectivity between my ROI and lets say 6 regions of the ACC as defined by an atlas, how to limit my connectivity to these regions instead of 15002 vertices? I've created a new atlas with my scout and the 6 ACC regions taken from the DK atlas, but after performing coherency, I got a 7 x 15002 resulting matrix, not the 1 x 6 I was expecting. I ask since I'm hoping to restrict my statistical analysis to just these connections of interest.
EDIT - So it looks like N x N is what I was looking for. I created a new atlas using the default anatomy with my 7 regions of interest, projected it to the my participants, then ran a N x N coherency with this atlas for each participant, then did a permutation test to compare their coherency maps. A couple of questions:
For processing the N x N coherency across subjects, is there a way to do it for each participant? When I add each participant to process1 and run the coherency analysis with the output configuration as save individual results, each trial under each participant gets a coherency result file. On the other hand, when I select 'concatenate input files before processing (one file)', I get only one result 'intrasubject' file. I can't seem to find the middle ground where one resulting coherency file is produced for each participant, so I ended up doing this manually.
With these N x N ROI coherency maps, how can I restrict my statistical analysis to just one ROI to the remaining ROIs? For example, I only want to compare between groups how their right DLPFC connectivity with all other regions differ, and am not interested in the connectivity of other regions with other regions.
PS. The scrolling for 'project to' is working great, thank you for that!
For processing the N x N coherency across subjects, is there a way to do it for each participant?
Not from the interface. The process Coherence NxN has to be called separately for each subject.
If you have many subjects, each one is taking a lot of time and you'd like to run sequentially at night or over the weekend, you could maybe try to script this: https://neuroimage.usc.edu/brainstorm/Tutorials/Scripting#Loop_over_subjects
With these N x N ROI coherency maps, how can I restrict my statistical analysis to just one ROI to the remaining ROIs?
If you use non-parametric tests in Brainstorm to test your NxN connectivity matrices between two groups of subjects, it doesn't matter if you have extra data in there. The tests for each pair of ROIs is computed independently from the others. For an NxN matrix, you would have NxN independent tests performed. If you run tests for values that you are not interested in, it does not affect the other tests.
There is just the FDR correction for multiple comparisions that you should probably avoid... I have no idea how this is supposed to work out for a connectivity matrix. @pantazis?
@MartinC Whenever you come across menus that might become too large (listing subjects for instance), you can now add this MenuScroller in just one line:
Sorry, yes I was referring to the correction of multiple comparisons with this N x N matrix. Would it be permissible to simply extract the p-values from the rows of interest for each frequency, and run 'mafdr' on this new matrix?
my resulting TF field has the size of 11175 x 1 x 10, which comes from my 149 scouts I used. Any advice as how to get just the one row I'm interested in (right DLPFC as my 'seed') for each frequency? I was expecting the first dimension to be 149 x 149 but that's not the case (I'm assuming the 11175 is the number of elements in the bottom triangle/below the diagonal of the matrix?). EDIT - This can be ignored, I found a way (although cheap) to get the last row needed.
Also, for the 'Time Window' option in the coherency analysis, could you please comment as to whether this should include the entire time window of the epoch available (in my case - 1 to 0.999 s), or just the time of interest (which would be 0 - 0.5 s in my case).
my resulting TF field has the size of 11175 x 1 x 10, which comes from my 149 scouts I used. Any advice as how to get just the one row I'm interested in (right DLPFC as my 'seed') for each frequency? I was expecting the first dimension to be 149 x 149 but that's not the case (I'm assuming the 11175 is the number of elements in the bottom triangle/below the diagonal of the matrix?).
Also, for the 'Time Window' option in the coherency analysis, could you please comment as to whether this should include the entire time window of the epoch available (in my case - 1 to 0.999 s), or just the time of interest (which would be 0 - 0.5 s in my case).
It depends on the frequencies your are interested in (don't expect obtaining a correct evaluation at 1Hz with blocks of recordings of 500ms) and your hypotheses (what you are expecting to see at which latency).
I do have another stats question related to imaginary coherency, and wasn't sure if it was worth a new thread, so if you don't mind, I'll post it below.
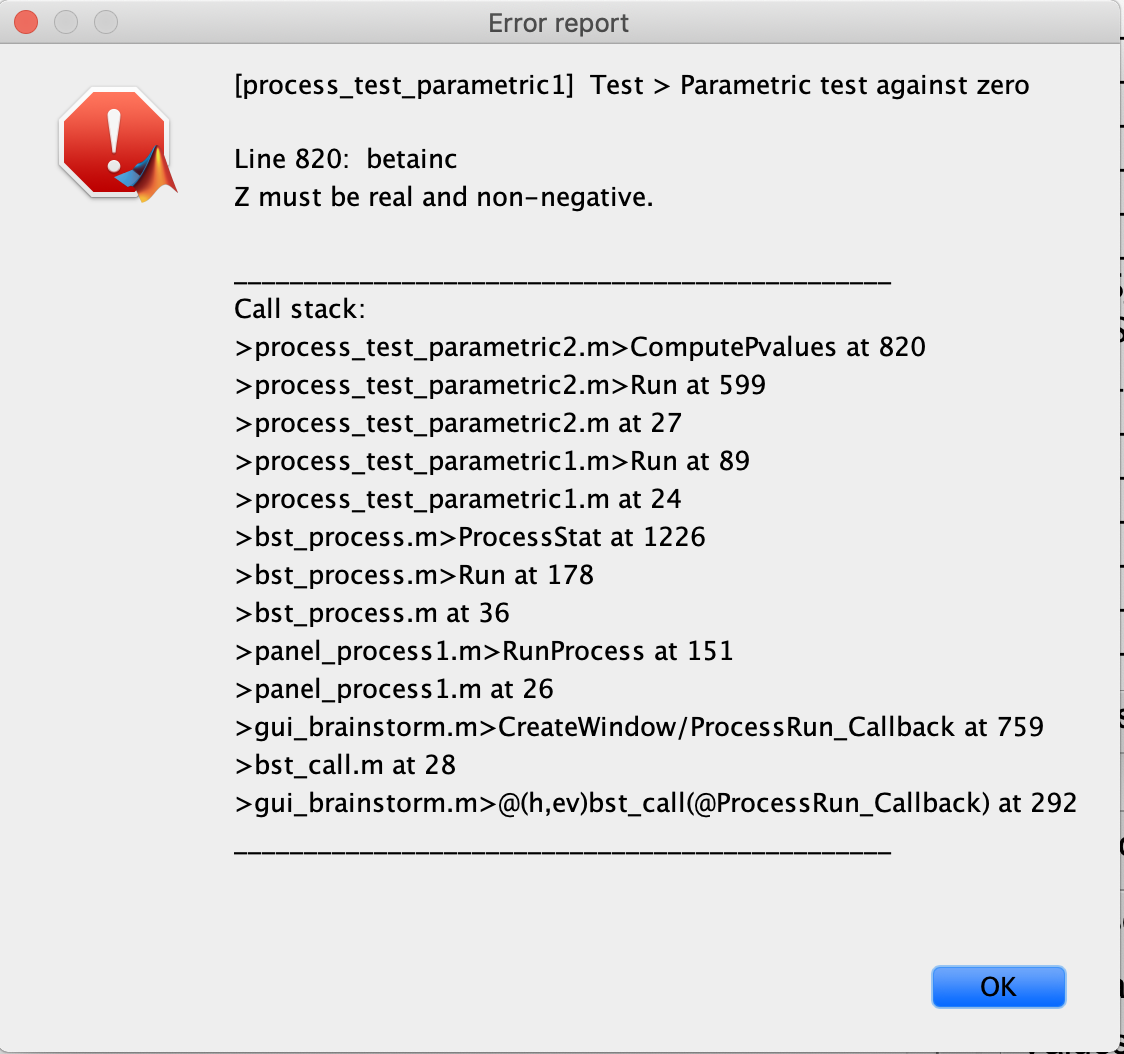
Using imaginary coherency in Brainstorm, I would like to show that two regions do have some sort of connectivity with each other, using the Destrieux atlas for my two regions. I added my individual subject coherency files to process 1, and attempted to do a one-sample student's t-test in the frequency range of 4 - 12 Hz, but I get the following error which I'm assuming is related to the imaginary part:
Using imaginary coherency in Brainstorm, I would like to show that two regions do have some sort of connectivity with each other, using the Destrieux atlas for my two regions. I added my individual subject coherency files to process 1, and attempted to do a one-sample student's t-test in the frequency range of 4 - 12 Hz,
Your coherence value IS different from zero, it is always strictly positive. This test would not be of much interest.
You need to formulate this as a contrast across conditions: eg. the coherence between ROI A and B is significantly higher in condition A than in condition B.
but I get the following error which I'm assuming is related to the imaginary part
The imaginary coherence is a real value. See the description in the header of the coherence computation function: