Hi - I have followed the processing sequence suggested in the Workflows Tutorial for constrained sources on EEG data, but when I extract the scout time series for each subject (after rectifying with absolute value), there appears to be a DC shift. I'm wondering if I should change the process order or is this expected? The only step I do not include here is Normalization, as I'm using dSPM which should produce normalized measures - correct? My steps are as follows:
Preprocess (filter 0.1 to 100 Hz, notch, SSP, etc.)
Epoch (with DC baseline correction, detrending)
Sensor average for each condition
Compute sources on sensor average (using dSPM)
Low pass filter sources (32 Hz)
Rectify sources (absolute value)
Extract scout time series
Group average scout time series
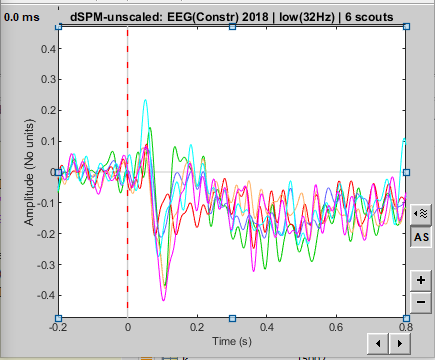
Below are examples of an individual subject without rectifying, with rectifying and then group average of sources that have been rectified - which seems to exaggerate the DC shift. Am I missing something in this process?
Below are examples of an individual subject without rectifying, with rectifying and then group average of sources that have been rectified - which seems to exaggerate the DC shift. Am I missing something in this process?
You figures do not show any "DC shift". Your baseline is nicely centered on zero.
If you mention the large bump between 200ms and 800ms: what you see is probably really related with the brain response.
If you mention what you observe in the rectified baseline, then do not rectify, or rectify only the scouts times series after computation. If you average values that are only strictly positive within a scout, you necessarily obtain something that is higher than zero...
Thanks for your response! I kept the unscaled dSPM output in order to complete stats analyses with them, which is what was suggested in the link you sent. I will try the scaled version instead for visualization and maybe that will adjust things appropriately. I was most concerned about the rectified baseline not looking right. I get that averaging positive values will make them greater than zero, so maybe I'll try not rectifying or do it later in the process.
Thanks,
Ann
I kept the unscaled dSPM output in order to complete stats analyses with them, which is what was suggested in the link you sent.
This sounds good.
I will try the scaled version instead for visualization and maybe that will adjust things appropriately.
Don't, it won't change anything.
I was most concerned about the rectified baseline not looking right. I get that averaging positive values will make them greater than zero, so maybe I'll try not rectifying or do it later in the process.
The more vertices you have, the more strictly positive values you average, the lower the chance to have a value close to zero.
Applying the scout function (ie. computing the average across vertices) before rectifying the signal will make it more look like little bumps going down to zero, but will not make it more right or more wrong.
You values are not zero on the baseline, but they are very close to it, I think your graphs look good the way they are now.
Depending on what you're doing, you could even skip the absolute value and keep the positive/negative values of the scouts. This way you'd have values alternating around zero.
Ok, great - I won't do the scaling - saves me time on recomputing! I might leave out the absolute value - it's not critical to the interpretation. One last dumb question - for the dSPM unscaled values, are they reported as magnitude (uV) or z-score? I've seen them reported both ways.
Ann