Could you guide me to the correct function/documentation, please?
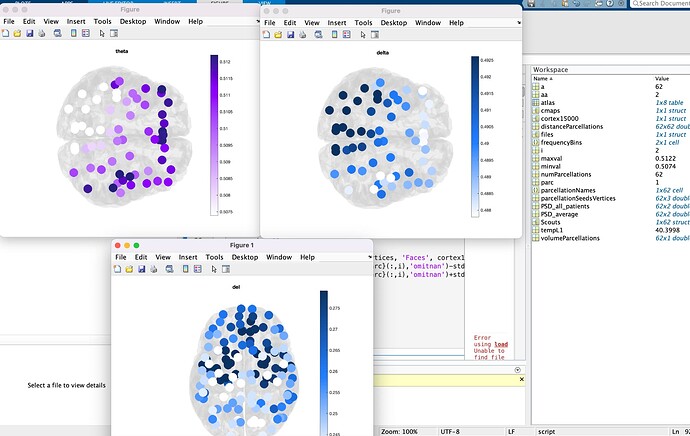
Context: I have hd-EEG data where I computed PSD (theta and delta) for each region in a cortical parcellation (i.e., DK parcellation; I have, for example, theta power for each of the 64 areas). Fig. 1 below.
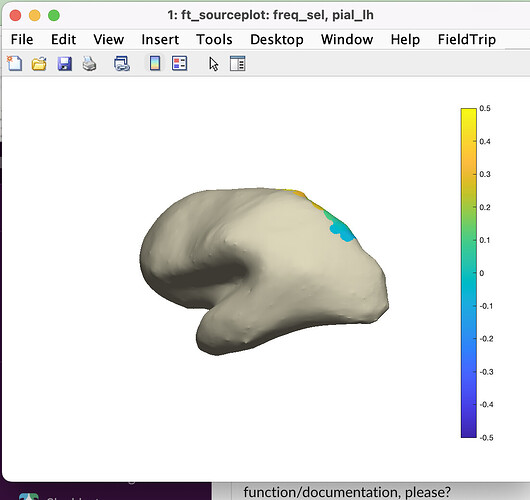
I want to plot a mesh (inflated or freesurfer based) where I 'color' some cortical parcellated regions (e.g., 2 and 10) based on some criteria. Fig. 2 below.
How can I load my PSD data back to Brainstorm to 'color' cortical parcellations based on an arbitrary PSD scale for each frequency bin?
Fig 2.
Hi @CamiloCastelblanco,
A way to do this is:
-
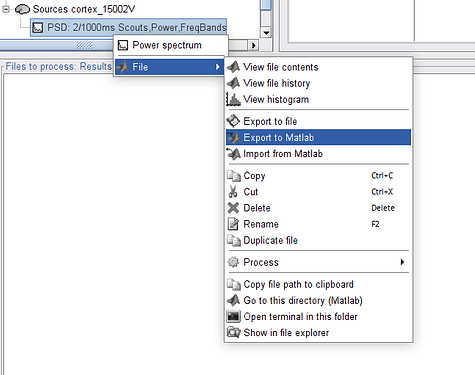
Compute a PSD (per bands) of the full cortex with Brainstorm, and export it as a Matlab variable:
-
The TF field contain the PSD values; its size should be [nVertices, 1, nBands]. Modify it with the power values you plan to plot.
Note: the same power value must be copied to all the vertices that correspond to one Scout (cortical parcellation): https://neuroimage.usc.edu/brainstorm/Tutorials/Scouts#On_the_hard_drive
-
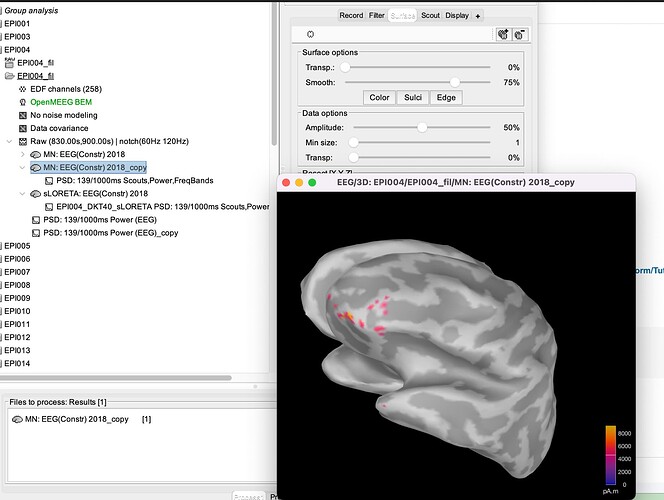
Import the modified PSD variable from Matlab to Brainstorm
Just change the Smooth slider once the PSD is plotted, to adjust how the surface inflation
https://neuroimage.usc.edu/brainstorm/Tutorials/ExploreAnatomy#Surfaces
Best,
Raymundo
1 Like
This was very helpful; thank you so much @Raymundo.Cassani !


