Hi sir ,
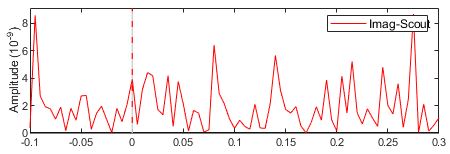
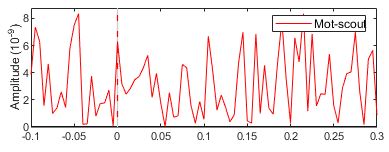
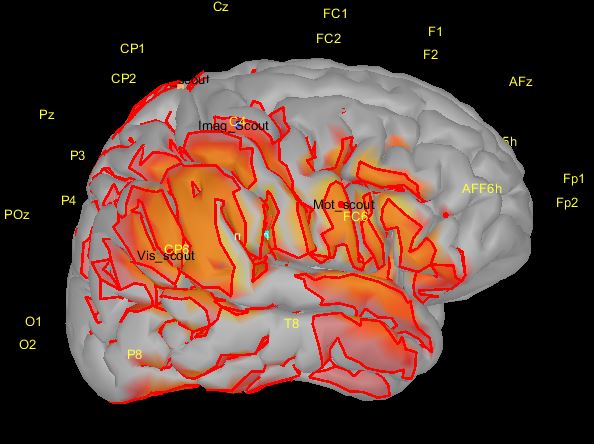
I am trying to find the current amplitude of each time point in epochs (-100-300 ms) for a scout. Actually, I want to find the relationship between the current values of the two scouts. When I downloaded the scout file in Matlab, I only get the vertices, seed and function applied on the scout. I have attached the time series plots of two scouts and the cortex plot in brain storm. Please suggest to me, how can I proceed??


You can compute the time series of the scouts explicitly and save the results in the database with the process "Extract > Scout time series". This creates a new file with the values displayed in the graph.
If you see any different between the figures obtained interactively with the Brainstorm GUI and the ones in the "matrix" file, it is possibly because of the display options of the scout, e.g. absolute values.
https://neuroimage.usc.edu/brainstorm/Tutorials/Scouts#Option:Absolute.2F_relative
Thanks for the reply. I have another query.
The EEG channels can be projected over the scouts (specific area in the cortex surface), so the extracted time series of the scout is the signal generated from that scalp EEG channel? Could you please highlight the insights (in-depth view) of "how the time series data/signal for epoch is extracted from scout"? I don't find any elaborative material in brainstorm tutorial. I have attached the sample image for your reference.

I'm not sure what you intend to do here.
If you want to explorer the brain activity at the source level, you need to go through the computation of a forward+inverse model, as illustrated in the tutorials.
"how the time series data/signal for epoch is extracted from scout"?
https://neuroimage.usc.edu/brainstorm/Tutorials/Scouts
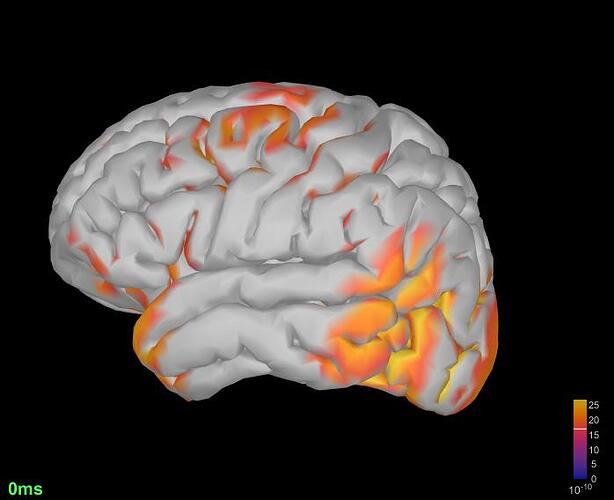
I have attached the sample image for your reference.
I'm not sure I understand what you intend to do with these scout stripes.
Make sure you follow all the introduction tutorials + the EEG/Epilepsy tutorial using the example datasets provided, before trying to process your own recordings.


