Hi,
I am interested in overlaying custom spheres to delineate ROIs in the 3D MRI Dipole viewer figure. The spheres would be defined by the following parameters.
- Radius = r
- Center = [x,y,z]
I would greatly appreciate any advice that can be provided!
Thank you
To do so, the idea is to generate a triangular mesh for the sphere and plot it.
Check the code snippet below.
% 1. Open the 3D figure with MRI slices and dipoles
% Sphere parameters
radius = 0.01; % In meters
nVertices = 32; % More for smoother sphere
colorRGB = [1,1,0];
transparence = 0.5;
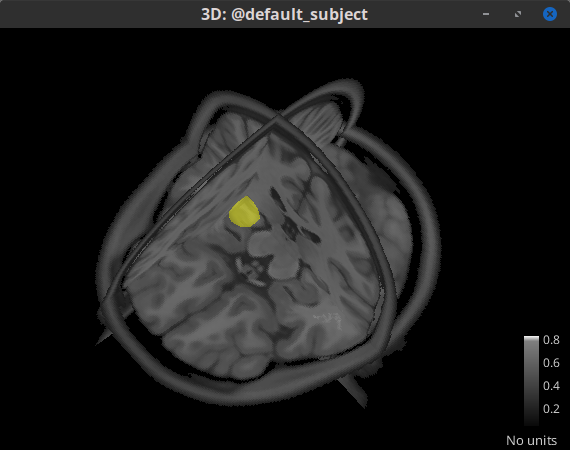
% Center of sphere is in right hippocampus
center = [2, -30, 32] ./ 1000; % In meters and SCS
[sphereVertex, sphereFaces] = tess_sphere(nVertices);
% Scale the sphere to 1cm
sphereVertex = radius .* sphereVertex;
% Position of sphere
sphereVertex(:,1) = sphereVertex(:,1) + center(1);
sphereVertex(:,2) = sphereVertex(:,2) + center(2);
sphereVertex(:,3) = sphereVertex(:,3) + center(3);
% Create display sphere as patch
figure_3d('PlotSurface', gcf, sphereFaces, sphereVertex, colorRGB, transparence);

radius and center are in meters, and coordinates are in the Subject Coordinate System (SCS)
https://neuroimage.usc.edu/brainstorm/CoordinateSystems
1 Like