I’m currently running specparam on my source‐space data to quantify the rhythmic and arrhythmic contributions in my analyses. Here’s what I’ve done so far:
1.Computed source model: MN, unconstrained sources, dSPM (cortical surface)
2. Flatten unconstrained sources by taking the PCA for each vertex.
3. Computed PSD features for each vertex.
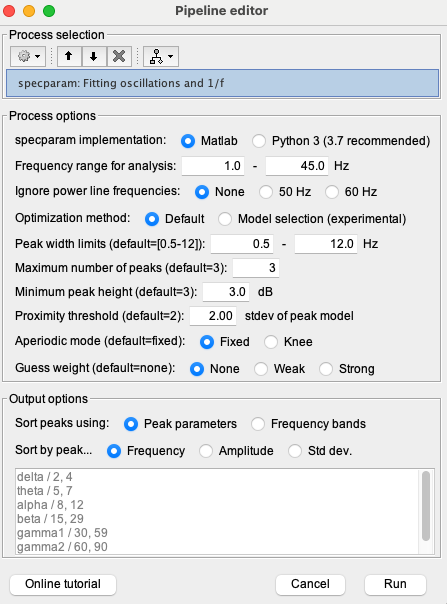
4. Applied specparam to PSD feature source file. Using parameters as below:
.
5. The script completes without error and produces a source file, which I can load in Brainstorm.
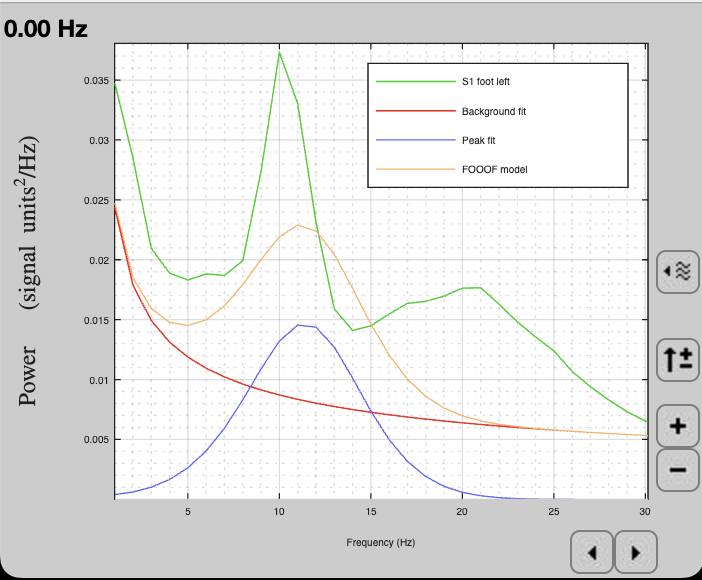
6. For each scout, I can plot the decomposed PSDs (rhythmic, arrhythmic).
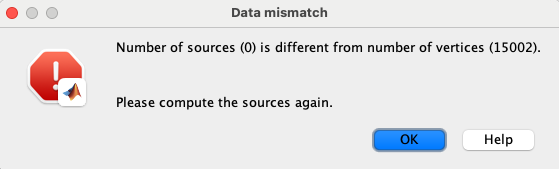
However, while browsing through these PSD plots I sometimes get the error: Data mismatch (number of sources (0) is different from number of vertices (15,002)). It only appears sometimes and doesn’t seem to prevent the plots from displaying, but it makes me wonder whether something went wrong.
Do you know what might trigger this mismatch error and whether it may be the cause suboptimal fit?
If I first compute a single PSD per scout and then run specparam on those scout‐level PSDs, I do not encounter this error and the fit of the model is better.
Could it be that the FOOOF was computed for Scouts rather than for Sources for the FOOOF files that are giving troubles? Asking as the shared figure seems to be computed for Scouts.
The fit indeed looks pretty bad, is this the case if you try for other vertices in the source file?
If I'm correct FOOOF was computed for the vertices. When I open the file contents I can see that it consists of 15002 structs. After opening the source file, I indeed plotted the PSD/FOOOF simulations for a scout and not for a separate vertex.
If I plot data of other scouts, the fit still does not look good.
@lindseypower and I discussed this issue and she told me there might be an unresolved issue with this code and provided me with another code that I can use in the meantime.
If you need more information on this issue, let me know,
Thanks for the explanation. Now I know what is happening.
First of all, the FOOOF fitting is well done at the source level.
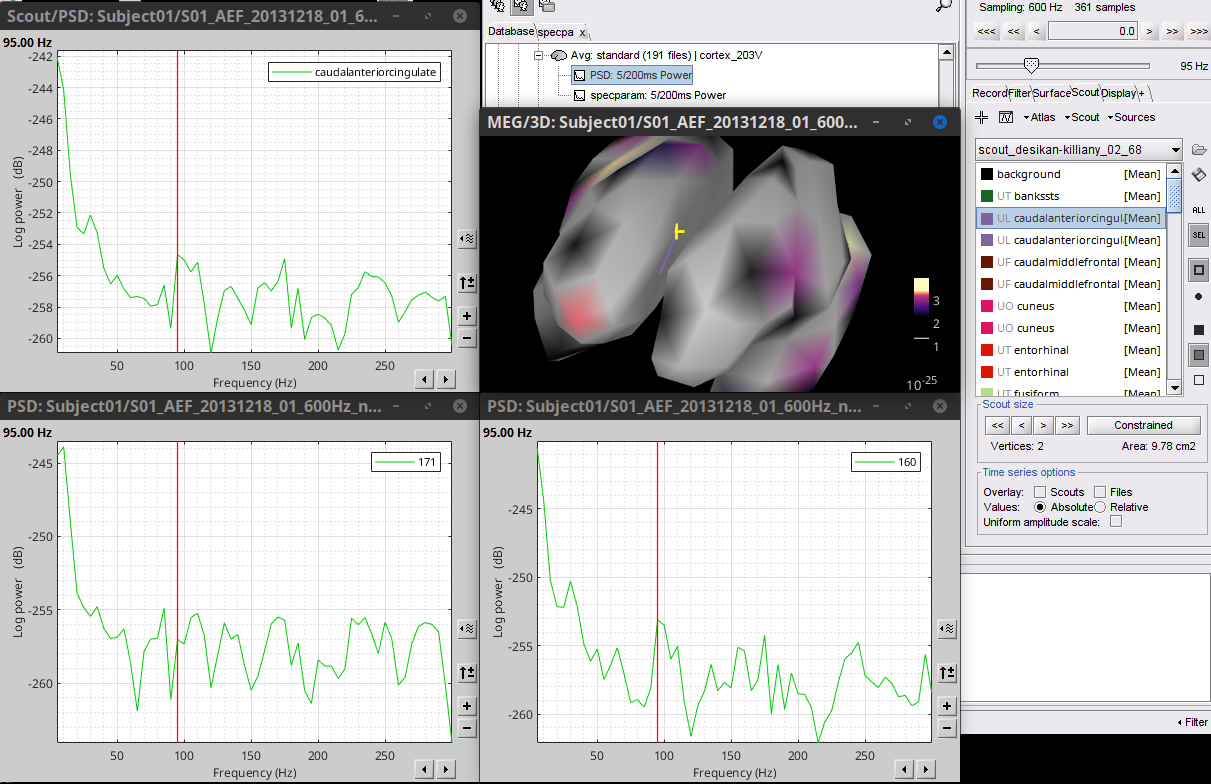
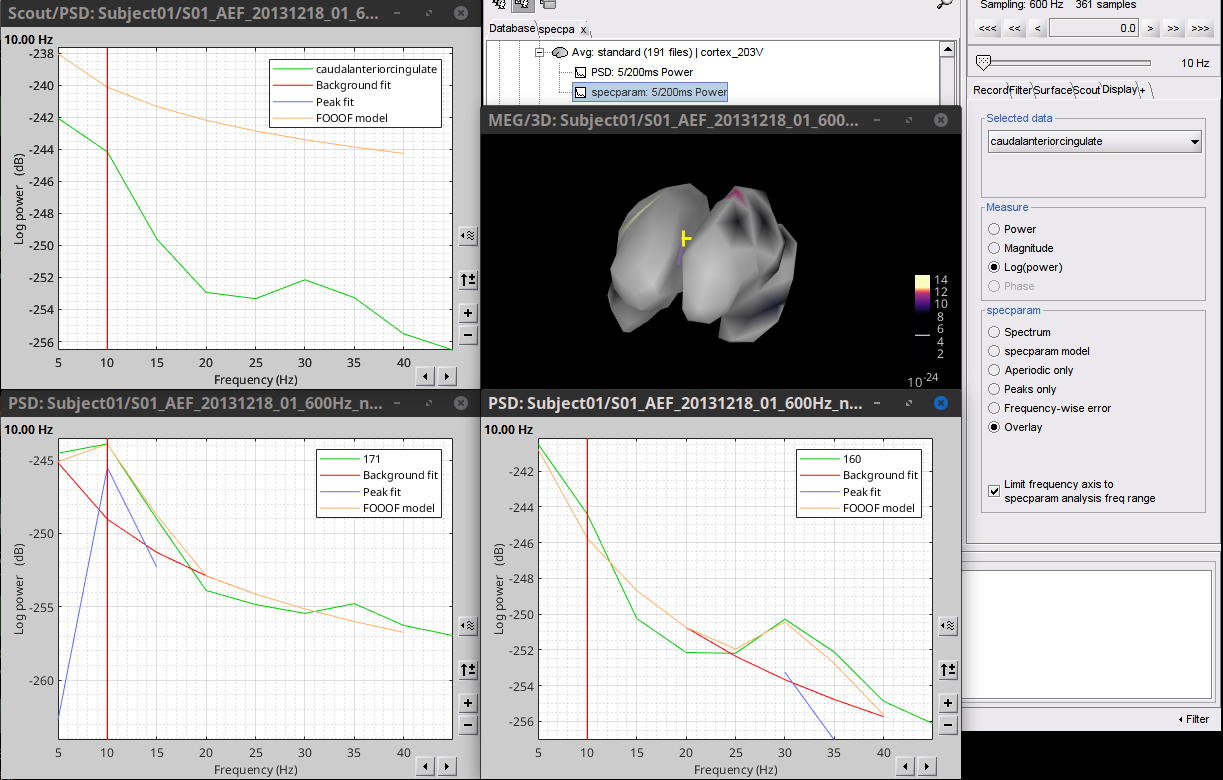
The issue is with the visualization. With PSD files, plotting per scout, applies the Scout function (e.g. mean) to the PSD data, check this example, where the Scout caudalanteriorcingulate is comprised of two vertices #171 and #160 (that is why it shown as line on the cortex). In the bottom PSD, you can see the PSD for each of the sources, and in the top-left fig you can see the mean of those two (as this is the scout function [mean])
Now, computing FOOOF in the same PSD file, these are the individual PSD and their FOOOF fit.
Bottom PSD in the figure below. Though the model for the Scout is wrong.
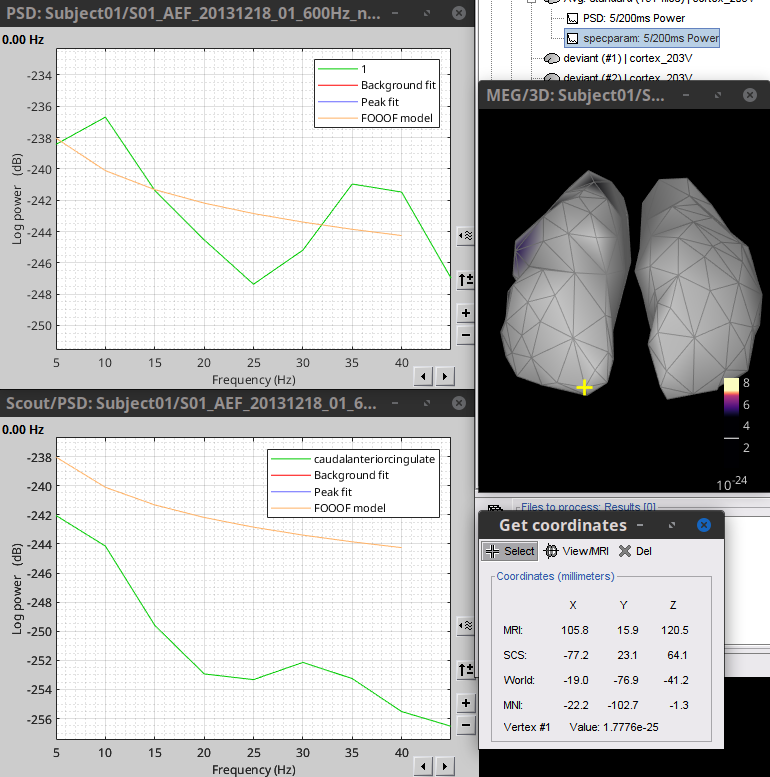
The FOOOF fit for the Scout is wrong. This is because the (scout) aggregation of individual (vertex) FOOOF models is not supported. So, it defaults to plot the FOOOF model for vertex #1. This is indeed a bug, the display of the scout-aggregated FOOOF will be removed as it does not make much sense to average FOOOF models. This figure below corroborates this buggy behaviour.