Difference between signals displayed in BST VS plotted in Matlab

Hi all!

I am unsure if this is a bug, but it looks like it…

I am struggling with trying to reproduce a database that I created a couple of years ago with a script. I updated my Brainstorm version by mistake since then, so I am aware that the difference might come from using a different BST version (different filters?).

However, while exploring the difference between the two database (the one generated a couple of years ago, and the one recently generated), I observed a strange thing.

I was trying to reproduce the data step by step for one subject, notably starting by :

  1. Review raw data
  2. Filter
  3. Apply SSP

At each step, I am importing a segment of data to observe difference (or no) with the old database. To do this, I was initially exporting the data into the Matlab workspace and plotting the signals and their differences.

I did not observe differences between the signals until the application of the SSP.
So I tried to export the SSP projectors from my initial database and import it in the second one, and I was still observing differences (although I was just applying the same SSP)..

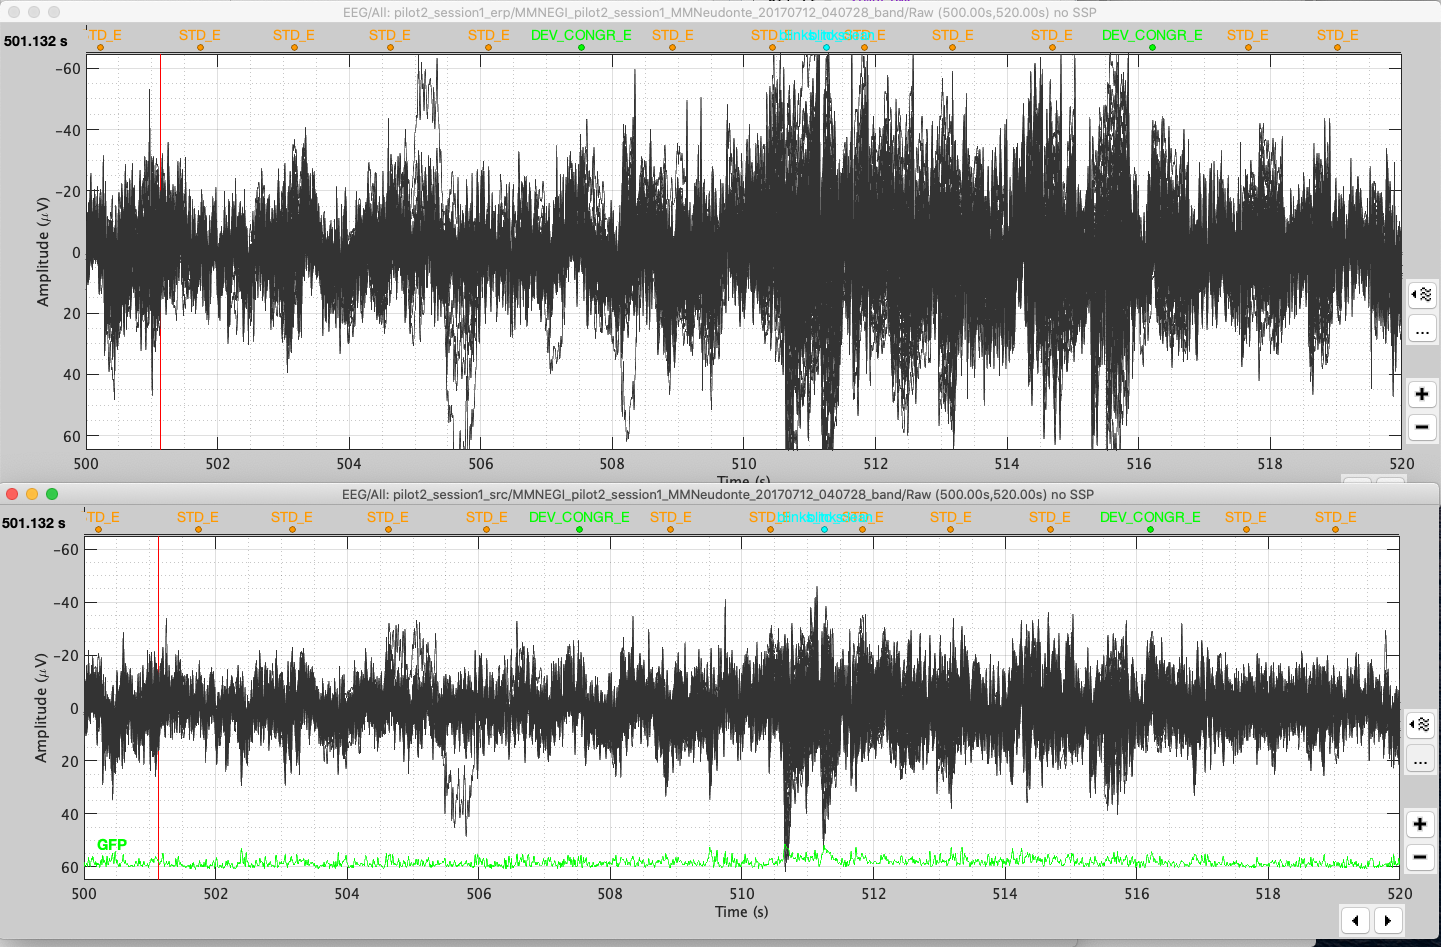
While I talked to John about the issue, we went back to the BST database and visualize the signal before SSP (after filters) and observe a strange thing (yes, the strange starts here) :

In BST, if I right click on the file -> EEG-> “ Display Time series” both on the old and new files, the signals appear to be different (see snapshot).

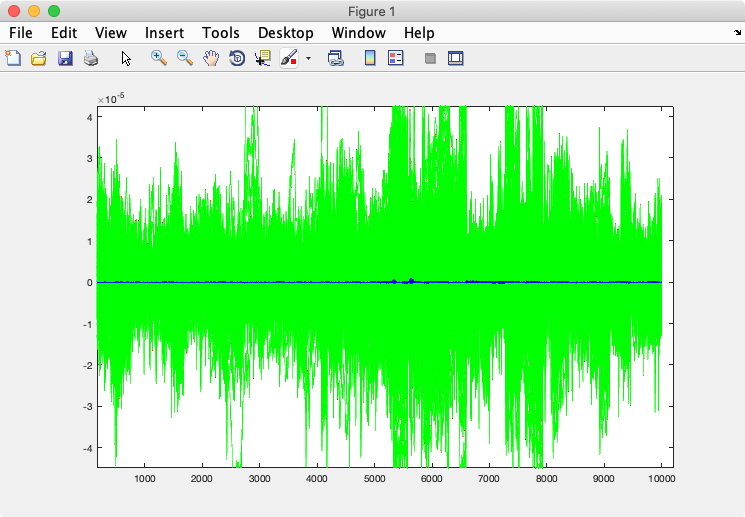
However, if I export the file to Matlab (right click -> File -> Export to Matlab) or if I load the variable from its original file (right click -> File -> Show in file explorer ->load in Matlab) and I plot the signals : they are strictly the same!! (see snapshot, command line : figure ; plot(d.F','r') ; hold on; plot(d.F'-s.F','g')) d and s being respectively old and new data)

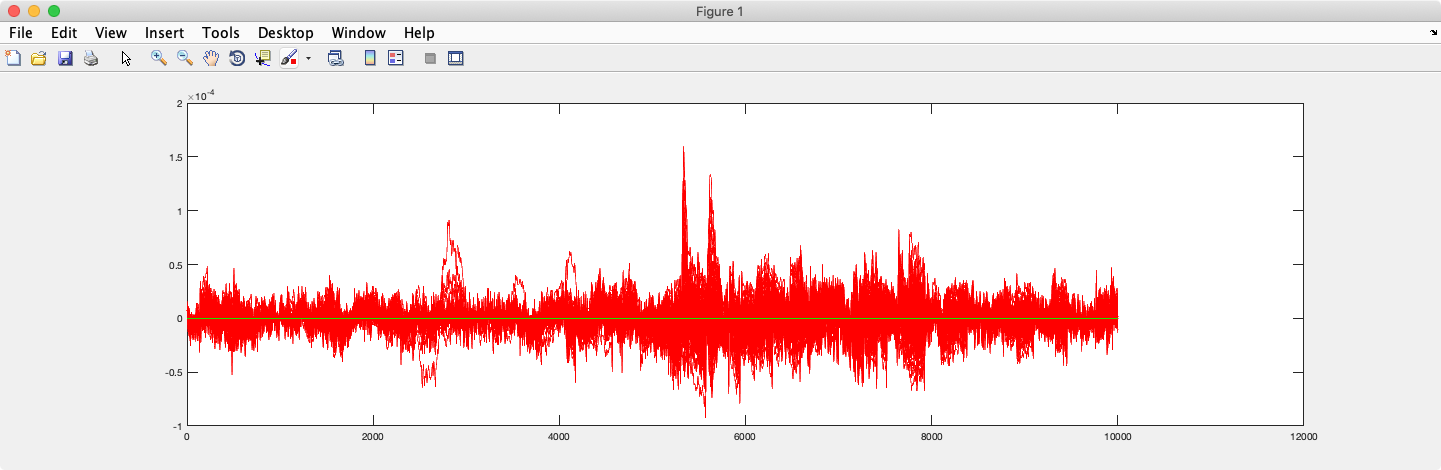
I am a little confused here, I was expecting to observe exactly the same thing between the BST interface and the matlab plot. (btw, BST Visualization filters are off) Am I missing something?

I would greatly appreciate some help to understand that issue. Please let me know if I can send any other information and/or the data which I am happy to share.

Cheers,
Anne-Sophie

Here is my MATLAB Version: 9.2.0.556344 (R2017a)

About the differences between versions

Different versions of Brainstorm and different versions of Matlab WILL produce different output.
If you need to reproduce strictly an old analysis, you should to keep the old version of Brainstorm attached to it, at least for validation purposes.

You can fetch any version after September 2016 from the github repository:
https://github.com/brainstorm-tools/brainstorm3/commits/master
Select any commit > Browse files > Code > Download zip.

If you need versions older than sept 2016, we have archives of all the previous Brainstorm versions, so just ask for a specific date.

About the problem you describe

You have a single Brainstorm protocol in which you have two files that look different when you double-click on them using today's Brainstorm version, but that look strictly the same when you plot them from Matlab?
If you don't have any filters or montages applied, that looks very suspicious.

Please create a minimal example dataset that allows to reproduce the issue:

  • right-click on the subject > File > Duplicate subject
  • remove all the files except for the channel file and the two data files
  • make sure you can still reproduce the behavior you don't understand
  • right-click on the subject > File > Export subject
  • upload the .zip somewhere and post the download link here.

Francois

Thank you Francois for your answer.

Here are the minimal datasets for you to test. I followed your instructions, just exported two subjects as they were separate subjects for in my databse for testing purpose).

https://filez.univ-amu.fr/kcfuqmvqcm
and
https://filez.univ-amu.fr/9ytd1w7tcg

Please let me know if I can provide other information.

You have lots of bad channels in pilot2_session1_src_copy, I guess that's the only difference...

Indeed! Thank you Francois for exploring the data and pointing that out. I feel reassured regarding the Matlab export.

Now I can further explore the difference between my two database. Following your recommendation I downloaded a BST version from 2017, but I cannot open some datasets (some variable do not exist anymore...e.g. 'samples' in events, etc).

However, the SSP correction that I have computed before 2018 differs from the one in 2020 (although it was computed on the same events). Do you, by chance, recall of any changes that could explain a slight difference in the resulting signals.

To illustrate this "slight difference" please find a snapshot below showing :
in red -> data corrected in 2018 (underneath the green signals) ;
in green-> data corrected in 2020 ;
in blue-> the difference between the two.

Do not hesitate to ask me if anything is not clear.

Thank you again!

AnneSo

Indeed. You shouldn't try to open a Brainstorm database with a version of the software older than the one that last accessed the database.

However, the SSP correction that I have computed before 2018 differs from the one in 2020 (although it was computed on the same events). Do you, by chance, recall of any changes that could explain a slight difference in the resulting signals.

If you have updated Matlab, this is enough to already obtain some differences, since the SVD implementation changed a few times.
For Brainstorm, all the history of the changes after October 2016 is available on Github.
For example: History for toolbox/process/functions/process_ssp2.m - brainstorm-tools/brainstorm3 · GitHub
The filters changed quite a bit, this is probably the main change.