Hi François,
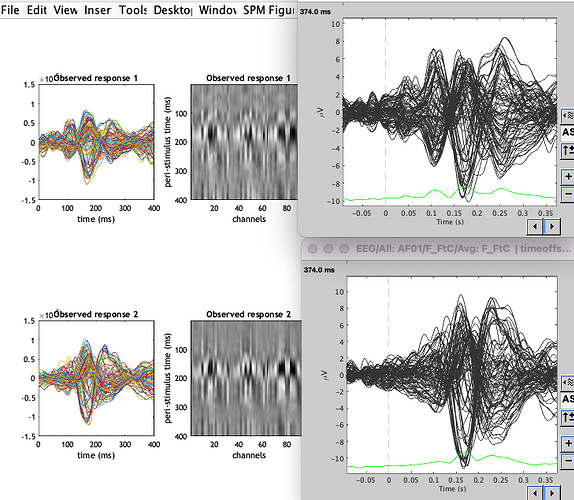
The screenshot attached shows an ERP in SPM and in Brainstorm (where I did all the pre-processing and epoching and then imported my data in SPM) in 2 conditions for one subject.
The shapes are very similar in the two software, but the amplitude of the signal seem to differ differently according to the time, which is quite weird. For example, in the first condition, the second peak is higher than the first peak in SPM but not in brainstorm while the third peak seems smaller than the second peak in SPM but not in brainstorm.
Do you know what happens? (I am not sure I should ask this here or on the SPM list, so I did both)
Best.
