Hello,
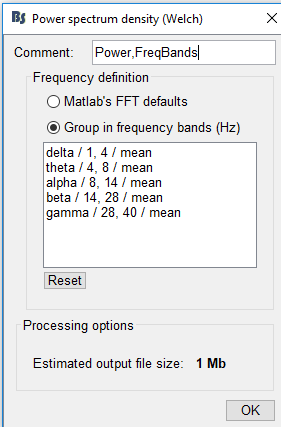
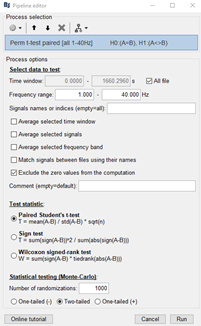
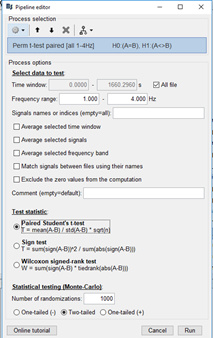
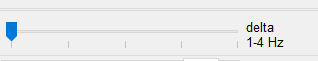
I am trying to figure out why different ttest results are achieved when specifying 1-4Hz frequency range and 1-40Hz (but grouped by frequency bin which has 1-4Hz). The result I gain from 1-40Hz, and selecting 1-4Hz on scroller, seems to have significance with FDR but when I specify the frequency range to 1-4Hz in the ttest
options (no frequency scroller) there is no-significance with FDR.
Thank you,
Also, sorry I have not replied to the last thread (on vertices and atlas) I made yet, I am still working on your reply.
Do you have the option “FDR” selected in the Stat tab when displaying the results?
If you do, the two files (1-40Hz and 1-4Hz) do not have the same number of values, the total number of t-tests is different, and therefore the FDR correction is different:
https://neuroimage.usc.edu/brainstorm/Tutorials/Statistics#FDR_correction
Hello Francois,
Thank you for the quick reply.
For the 1-40Hz, I found number of Ntests were 5 times larger (since we have 5 groups of frequencies) than the 1-4Hz. Since larger number of Ntests makes the Benjamini FDR more strict, I would have expect the FDR to be more strict for the 1-40Hz than the 1-4Hz. However, our results showed the opposite, 1-4Hz had no FDR significance and 1-40Hz had FDR significance. (1-4Hz and 1-40hz comparison uses the same data)
Do you know why the comparison with larger Ntest number would be more FDR significant than the lesser Ntest number?
Thank you,
FDR is related with sorting all the p-values and estimating a threshold from the obtained distribution.
Using more frequency bands leads to a different number of tests, but most of all modifies this distribution.
The outcome is not necessarily that more tests means lower corrected p-values.
(this is my understanding, but maybe this is wrong… @dimitrios can you confirm?)