I'm trying to do PTE connectivity based on more than one pair of scouts, and I found that when I used different scouts, such as 5 scouts vs. 10 scouts, the output PTE value (whether or not it was normalized) is slightly different. Is that possible? What is the reason behind it?
I am not familiar with this function, but it seems unlikely that the PTE between two scouts would depend on the values estimated for another pair of scout.
Whether you compute the PTE for scouts A/B or for scouts A/B/C, you should obtain the same interaction A/B.
@duanjipeng Please be more specific. How did you get to observe that the values are "slightly different"? If this is something you can reproduce, could you please describe precisely how we can reproduce your observations? (If possible based on the TutorialIntroduction protocol, so that you don't have to send us any data)
Drag and drop reconstructed sources data (a total of 10 scouts were project to each file) from 2 subjects (for testing purposes) in Process1 tab.
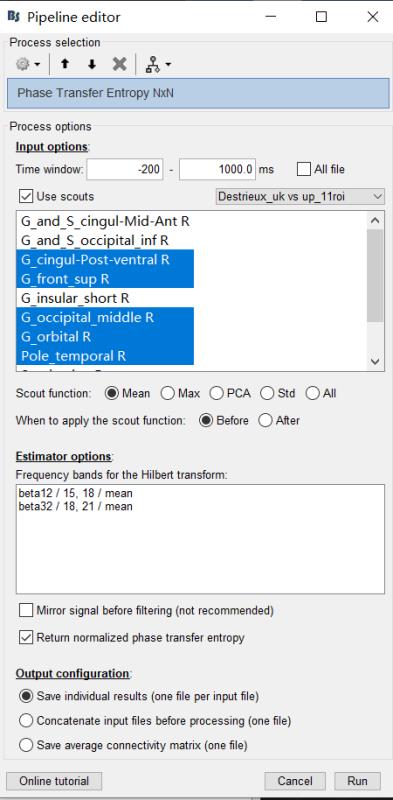
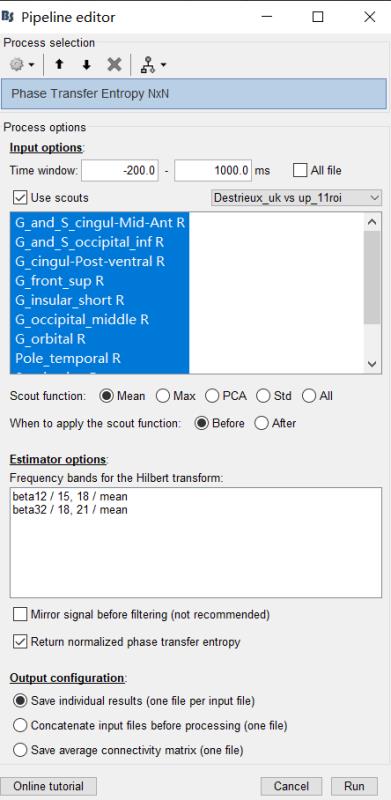
Click on [Run] to open the Pipeline editor.
Run the process: Connectivity > Phase Transfer Entropy NxN. Then I chose all 10 scouts and two frequency bands (15-18Hz & 18-21Hz) to do PTE connectivity.
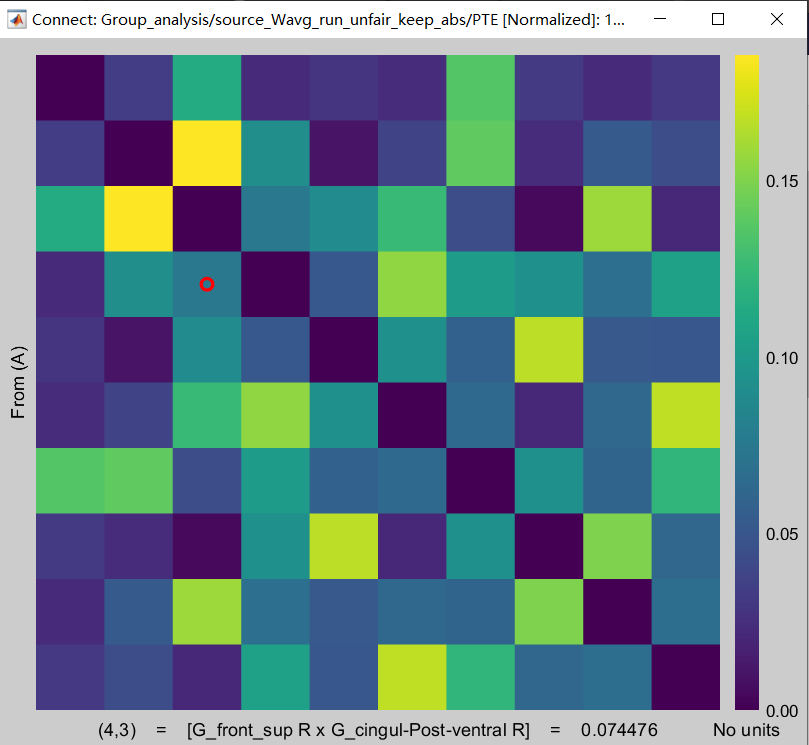
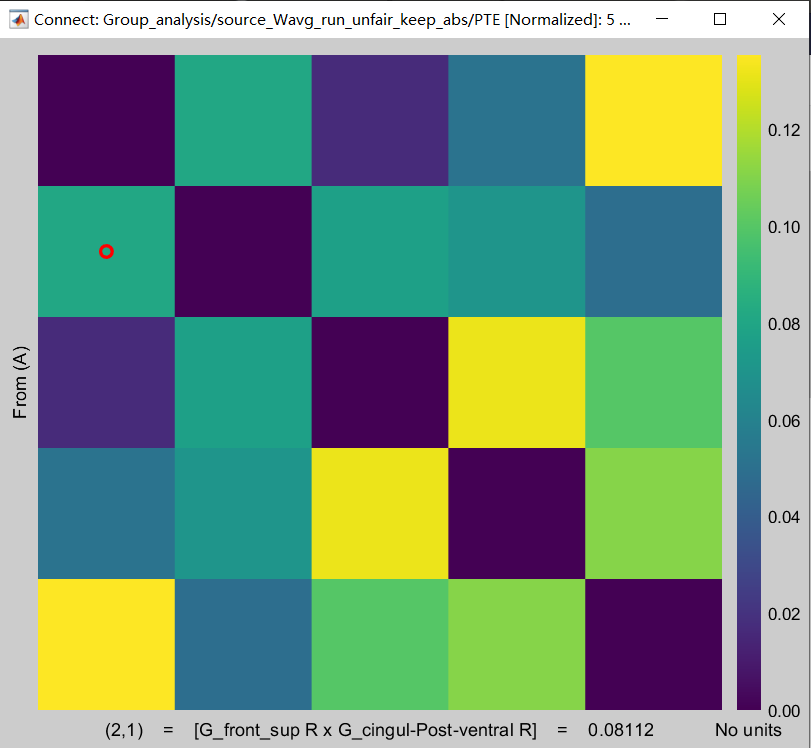
When comparing the results of these two operations on the same subject and same frequency band, I found that the PTE value between scout A & B is slightly different. For example:
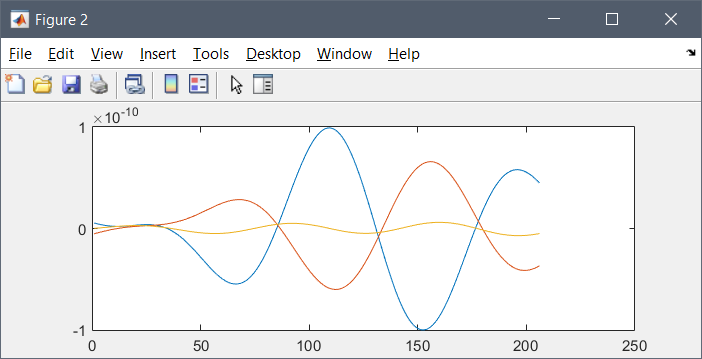
Indeed, I could reproduce this behavior, with only one file, and 2 or 3 scouts, independently from any other options in the process. The function PhaseTE_MF behaves differently for 2 or 3 signals.
Examples at line 577 in bst_connectivity: [dPTE, PTE] = PhaseTE_MF(permute(DataAband, [2 1]));
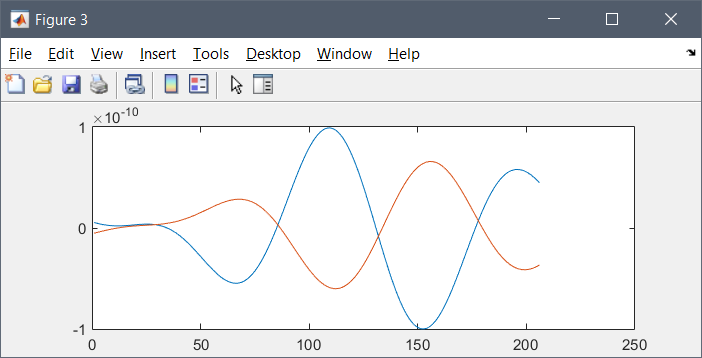
Two examples for DataAband (for the second figure, the 3rd signal was removed):
Thanks for Francois's prompt responses. This is not an urgent issue, but it has been bothering me for quite a long time and I am really looking forward to your early reply. Thank you very much.
@duanjipeng
I checked the function and the paper it refers to.
I guess the paper just talks about a bivariate case but some part of the code when it wants to find the "delay?" for each channel, it checks the "phase" with all other channels, so when you have more channels somehow that changes. I'm not very familiar with PTE but that's where the difference happens. So we need to see whether PTE is a multivariate metric or not.
I don't remember, this is the typical order of colors in Matlab when displaying multiple lines.
This is a result you can easily reproduce with extracting 2 or 3 scouts from any source file. Which is what you've done in your example.
The question of importance is the one @hossein27en asked:
is this a bivariate or a multivariate metric?
=> @MartinC and @Sylvain are the authors of this method, it would be nice to hear from them.