Hello,
Im following the omega pipeline tutorial on resting data https://neuroimage.usc.edu/brainstorm/Tutorials/RestingOmega#Power_maps
And i am trying to project my mean relative power onto the cortex for two participants with different lengths of data. One participant has 10 seconds of data and the other 8 seconds. I ran my power spectrum welch and then computed relative power for each participant. Then i moved my mean relative power for each participant into the process box, clicked on process time frequency - run- process selection - average - average files- group files = everything, function = arithmetic average (un-click match signals between files using their names and exclude the flat signals from the average) - run
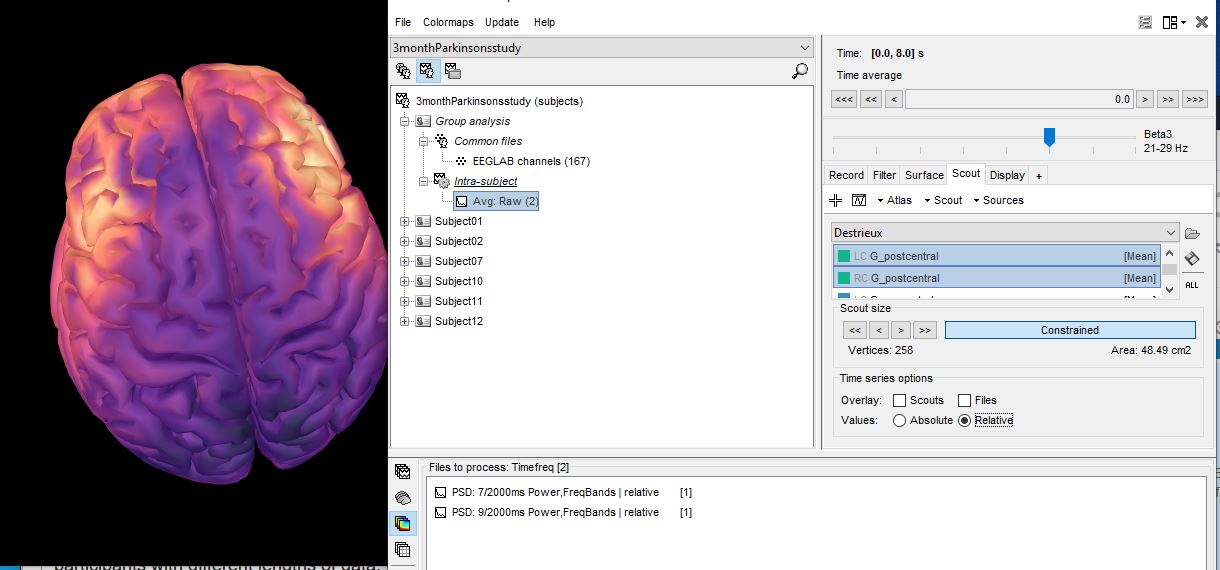
Here's my mean relative power maps averaged across two participants
My question is about the time in the right upper hand corner. I'm assuming the averaged file is an average of time as well. And that's why i get the number 8 (since brainstorm shaves off 1 second per PSD file)
I guess, i just want confirmation that the brain graph i am displaying shows the average relative PSD of two participants for each frequency of interest and time is not really a factor in this graph. For example, brainstorm is not displaying an average of 8 seconds of data for each frequency band for each participant (because that wouldn't be possible for 1 of my participants). Rather brainstorm is taking the relative PSD values for each frequency band of interest for participant 1 and 2 , averaging those values and then projecting the values on the cortex?
Last question, is there a way i can display power values for one region of interest on the whole brain? For example, the only portion of the brain that would "light up" and the rest of the brain remain grey, would be the precentral and postcentral left and right regions of interest.
Thanks very much
The PSD results have no temporal dimension, but a time definition is needed in a file to be loaded and displayed in Brainstorm.
- When computing a PSD from a continuous file, the segment used for the evaluation of the PSD (eg. 0-50s), is used as the time definition.
- When averaging PSD files, it uses the time definition of the first file in the Process1 list. Change the order of the files, it would change the time definition.
As a conclusion, I'd say you should not rely or try to interpret this time window.
Rather brainstorm is taking the relative PSD values for each frequency band of interest for participant 1 and 2 , averaging those values and then projecting the values on the cortex?
If you average two PSD files, it would compute the mean of the spectra (ie. the values stored in the files), regardless of the duration of the time window that was used. It is your responsibility to average files that have similar levels of noise.
Last question, is there a way i can display power values for one region of interest on the whole brain? For example, the only portion of the brain that would "light up" and the rest of the brain remain grey, would be the precentral and postcentral left and right regions of interest.
Process "Simulate > Full source maps from scouts" with no noise. If you don't find it, update Brainstorm first.
https://neuroimage.usc.edu/brainstorm/Tutorials/Simulations#Generate_full_source_maps_from_scouts
Hi Francois,
Thanks very much for your help.
I am stuck on my last question regarding "stimulate full source maps from scouts with no noise"
I followed the tutorial as best i could, but my set up is quite different than the tutorial so i just did my best.
Here what i did
- After computing average relative power for 2 participants. Brainstorm created a group analysis section that contained my frequency averagedata:RAW(2) file.
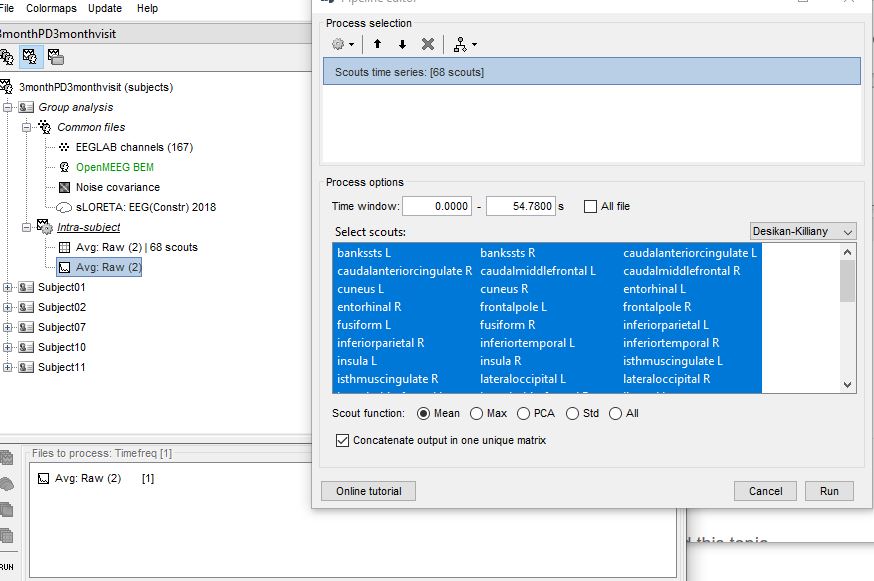
- To have to option to stimulate these recordings i needed to create a matrix. I pulled my frequency avg RAW file to files to files to process, clicked timefreq and run. The process selection pops up and i click "extract scouts time series" and then my matrix file is created. Heres a picture
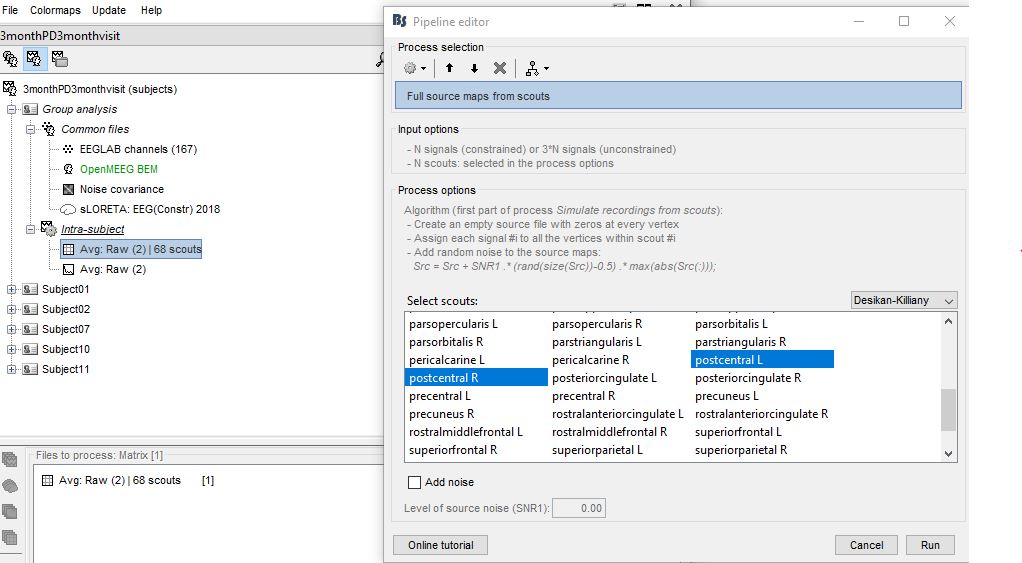
- After that, i moved my matrix file to files to process - stimulate - full source maps from scouts-i select the 68 scouts i have in my file from the desikan-killiany scout map -no noise- run.
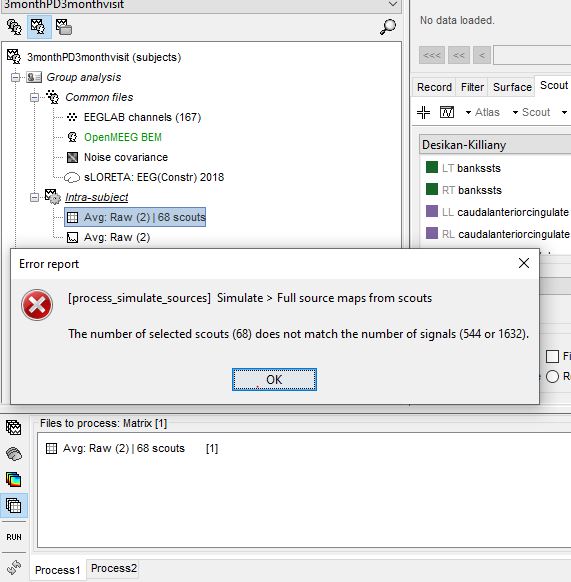
I get the following error
Not sure where i went wrong
Thanks very much for your help
Hi Francois, my apologies, for the 1st picture in my last comment, i selected all scouts (not just 2). Here is a better picture
The process "Extract scout time series" creates a matrix file with one signal for each frequency and for each scout. If you have 68 scouts and 8 frequency bands, you get a file with 544 signals.
The process "Full source maps from scouts" does not handle multiple frequencies. If want to use it with these power results, you need to use it for only one frequency band at a time.
When creating your PSD file, either you compute one file for each frequency band separately, or you use the process "Extract > Extract values" to keep only one frequency band. Then you call the process "Extract scouts time series", you'll get a file with 68 signals you'll be able to use in the simulation process.
Hi Francois.
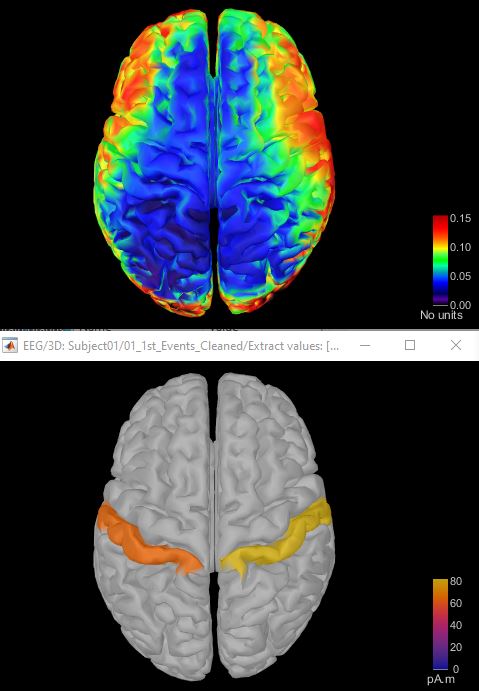
Thanks for your help. I followed your directions and was able to project beta power band activity on a single scout. Problem is, it gave me a mean power value across the entire scout. I wanted power values for each voxel within the two scouts i selected. For example, the first picture below shows averaged participant beta power for each voxel on the whole cortex (im assuming?) and the next picture shows a single value for beta power across the postcentral cortex. I basically want picture 1 to only show the activity of the postcentral region per voxel and the rest of the cortex remain grey. Hope this is possible. Thanks very much for your help
Im also wondering why the units are different?
I basically want picture 1 to only show the activity of the postcentral region per voxel and the rest of the cortex remain grey.
I'm sorry, there is no menu for this in Brainstorm.
Either you use photoshop, or you manually edit the ImageGridAmp values directly in your file.
Get the indices of the vertices in your scouts (cortex surface, field Atlas(?).Scouts(?).Vertices), and set the values of all the other vertices to zero. This requires some Matlab programming skills.
You'll find everything you need for doing this in the Scripting tutorial:
https://neuroimage.usc.edu/brainstorm/Tutorials/Scripting#File_structures