Dear Brainstorm community,
I wanted to ask you about a certain situation I have been dealing with some methodological aspects of a study we are working on. And it's probably a simple one to answer. And although I've read, I think, all the topics covered in the tutorial and some of the forum I'm still not sure.
Our study compares EEG activity between two situations (participants with and without a certain condition) and for this we have resorted to, after performing the appropriate preprocessing (filtering, artefact removal, ...) the calculation of the PSD using the Welch method for the predetermined frequency bands in Brainstorm. And to make a comparison between those two situations or groups of participants we used the permutation test. To visualise the results of the statistical differences between groups we used the options "2D disc" and "display on scalp". I have not given more data on sample sizes, etc. in order not to complicate the explanation.
Now comes the question, after a review of the paper that we have sent, we are told that "It seems that this method includes a reverse solution to detect activity in source space". However, we thought that we were using a forward solution and that we had always used the detection of activity in the sensor space. So is it possible that in some of these steps we have made use of the reverse solution and the calculation of activity in the source?
We thought that the latter was only obtained if we had previously calculated the sources. And on the other hand, that the inverse solution was only used in the case of making use of the calculation of the sources and their projection in a model.
Thanks in advance!
From the described pipeline, there is not an inverse model, all the analysis is carried on in the sensor space. There may be a confusion on the reviewer side with the 3D scalp visualization.
The Display on scalp visualization is just an interpolation of the PSD values on the scalp surface. It uses the same approach as Display on 3D sensor cap, but in the last one the vertices defining the surface are the channel locations.
The fact that both approaches are interpolations can be clearly observed when the EEG electrodes are also visible in the figures: right-click > Channels > Display sensors and > Display labels
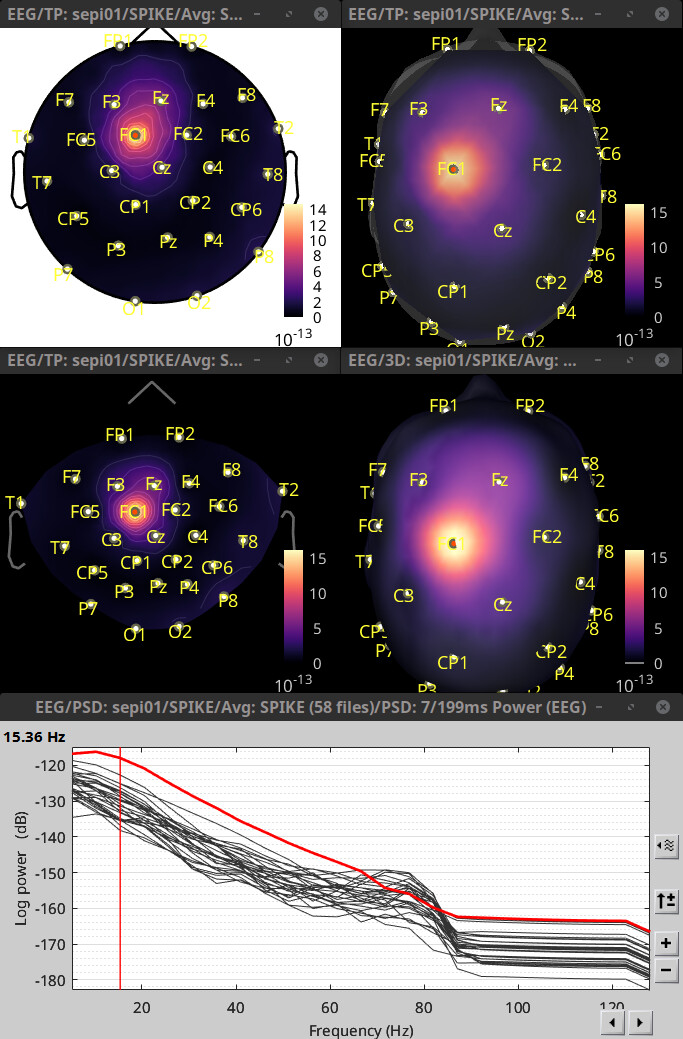
Selected channel (in red): FC1
Top row left: 2D Disc
Top row right: 3D Sensor cap
Mid row left: 2D Sensor cap
Mid row right: Display on scalp
Bottom row: PSD
Dear Raymundo,
We are very grateful for the prompt reply. Now we feel more confident and we see that the tutorials allow us to understand these concepts without error. We did not want to advance a perception that we had, but it also seemed to us, as you suggested, that this comment was a confusion of the reviewer with the 3D scalp visualization.
Again, thank you very much.
One more detail: when analyzing in sensor space, you're not using the forward solution either. The forward solution is needed when computing the inverse solution. Cheers