Dear Brainstorm developers and community,
I have a question regarding the process of using the Hilbert transform to calculate functional connectivity metrics (such as wPLI, PLV) for epoched data in the Pipeline Editor, and I would like to ask for your insights. The details are as follows:
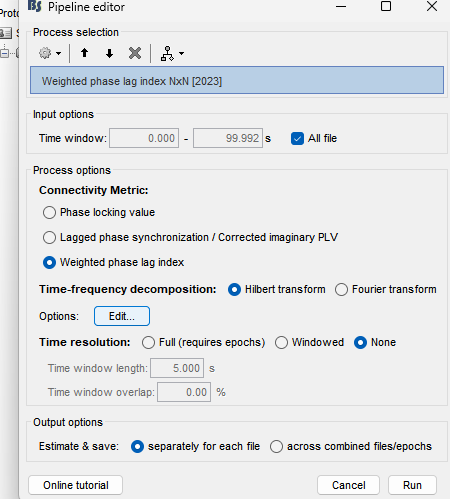
While following the functional connectivity tutorials, I found the connectivity module's GUI to be highly integrated, convenient, and excellent for reproducibility. However, when selecting Hilbert transform in the time-frequency decomposition and setting the time resolution to None (to calculate the static connectivity matrix), the software automatically performs band-pass filtering and the Hilbert transform at the bottom layer, and immediately compresses the time axis to output the final averaged matrix. This makes it impossible to crop out the head and tail edge effects caused by filtering within the GUI when processing short-segment resting-state data (such as 2-second or 10-second epochs). Therefore, my question is, will this affect the accuracy of the functional connectivity metrics? If there is an impact, is there a solution?
Initially, I wanted to proceed step-by-step, which means performing the Hilbert transform first, then cropping the head and tail edge effects through the extract time option, and then performing the functional connectivity metric calculation, but this seems impossible to achieve. Therefore, the method I am currently considering is to directly use the un-epoched or concatenated continuous resting-state data, use the windowed option in time resolution, set the time window length to the desired epoch length, and set the time window overlap to 0%. I wonder if this is acceptable? Or is there a more effective processing method?
In addition, even if this method is feasible, it seems it can only be used for resting-state data and cannot be used for task-state data.
I would be extremely grateful for any guidance or recommendations you could provide. Thank you very much for your time and help!
Best regards,
Deyu Li.