Hi Francois,
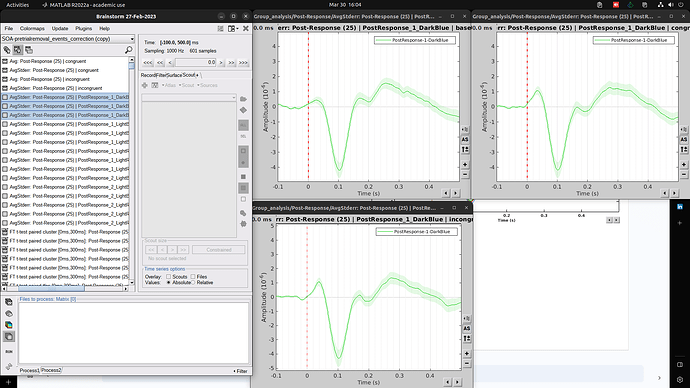
I'm trying to display ERP of 3 conditions together for specific clusters with standard error across subjects. When I averaged over all the subjects and generate cluster ERP with mean+stderr it plots the standard error across the cluster than subjects. So I extracted the cluster time series of each subject and averaged the cluster time series across subjects with standard error. Now I have 3 averaged time series for each cluster (3 conditions) which I want to display as a plot overlayed together with conditions in the legend. When I double-click them they are opening in different windows. How can I display the time series together?
Thanks in advance,
Sainath Murali
