Dear all,
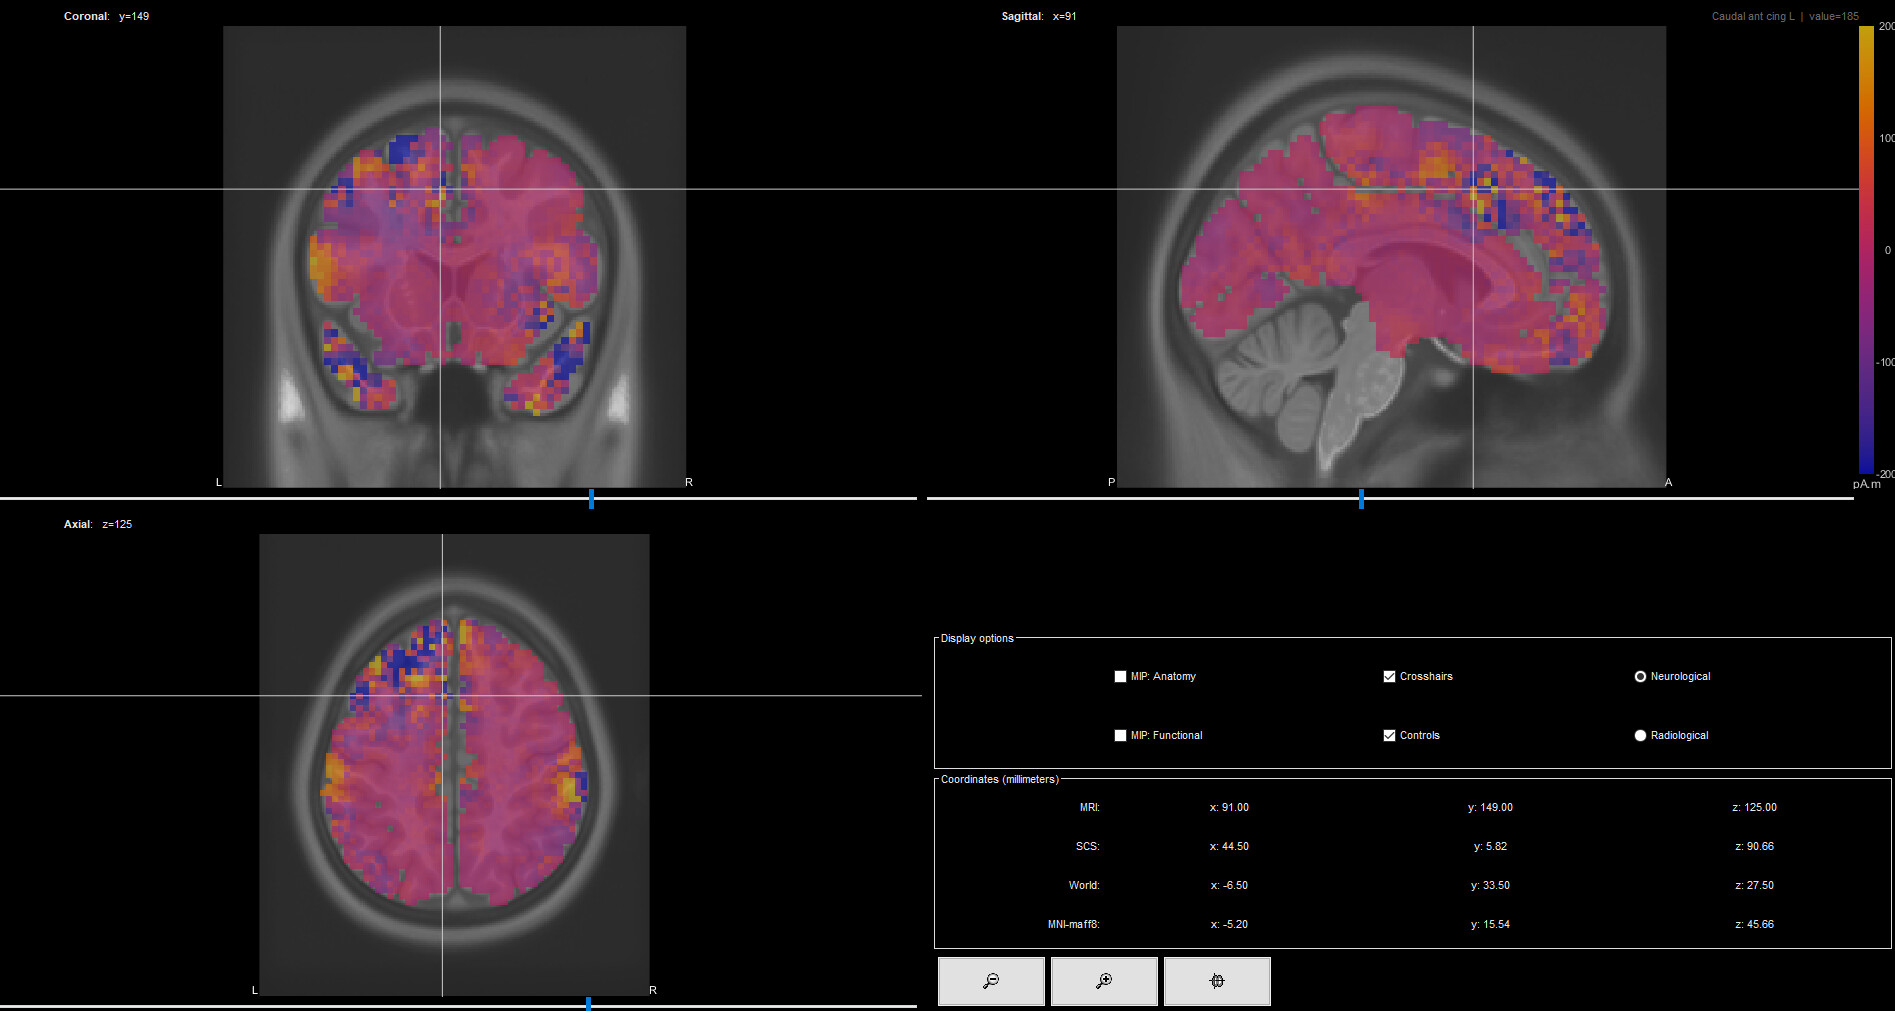
I am currently working with intracranial EEG data to perform source localization of a certain ERP-component. I have used unconstrained current source density analysis using a volume head model. The CSD maps are displayed like this:
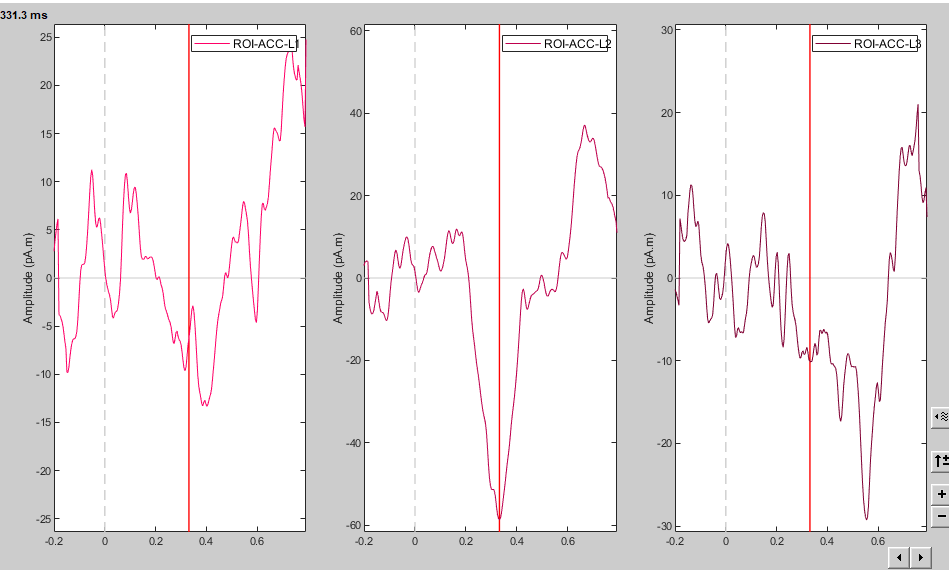
I have also created scouts for a ROI-based approach and I have seen that is possible to display the relative current density waveforms in 3 orientations:
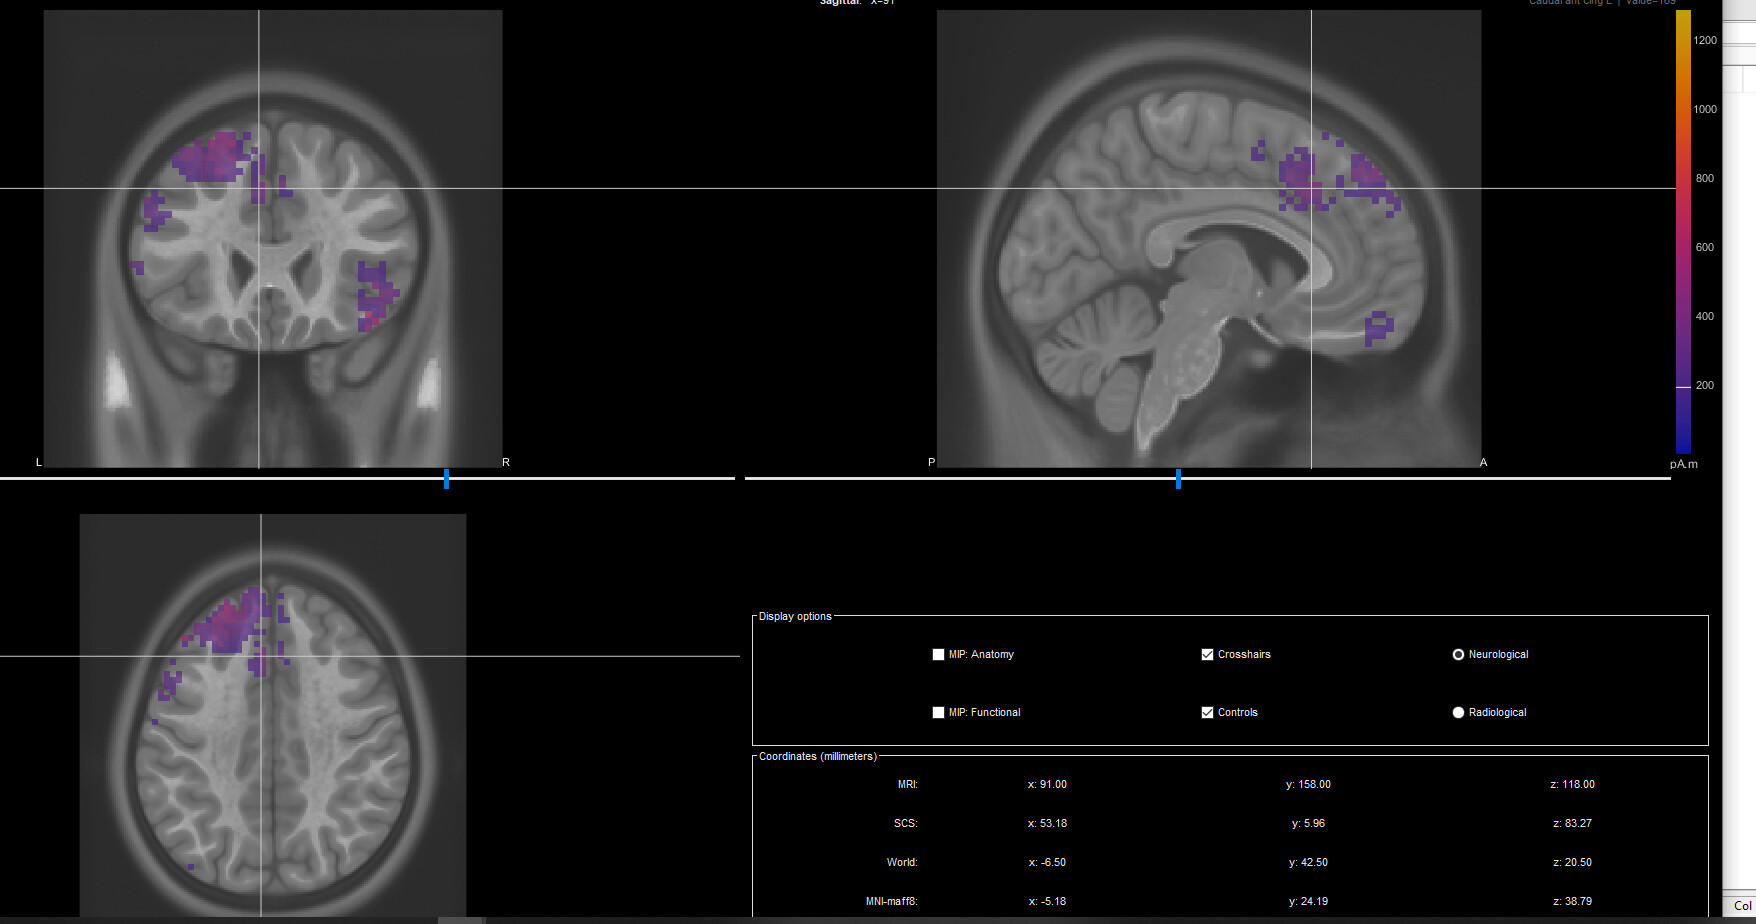
I am, however, very interested to visualise the current sources and sinks with respects to their anatomical location. I have read online that you can uncheck the 'absolute value' option when looking at CDMs, but when I try this nothing really changes (it looks exactly the same as the absolute value option):
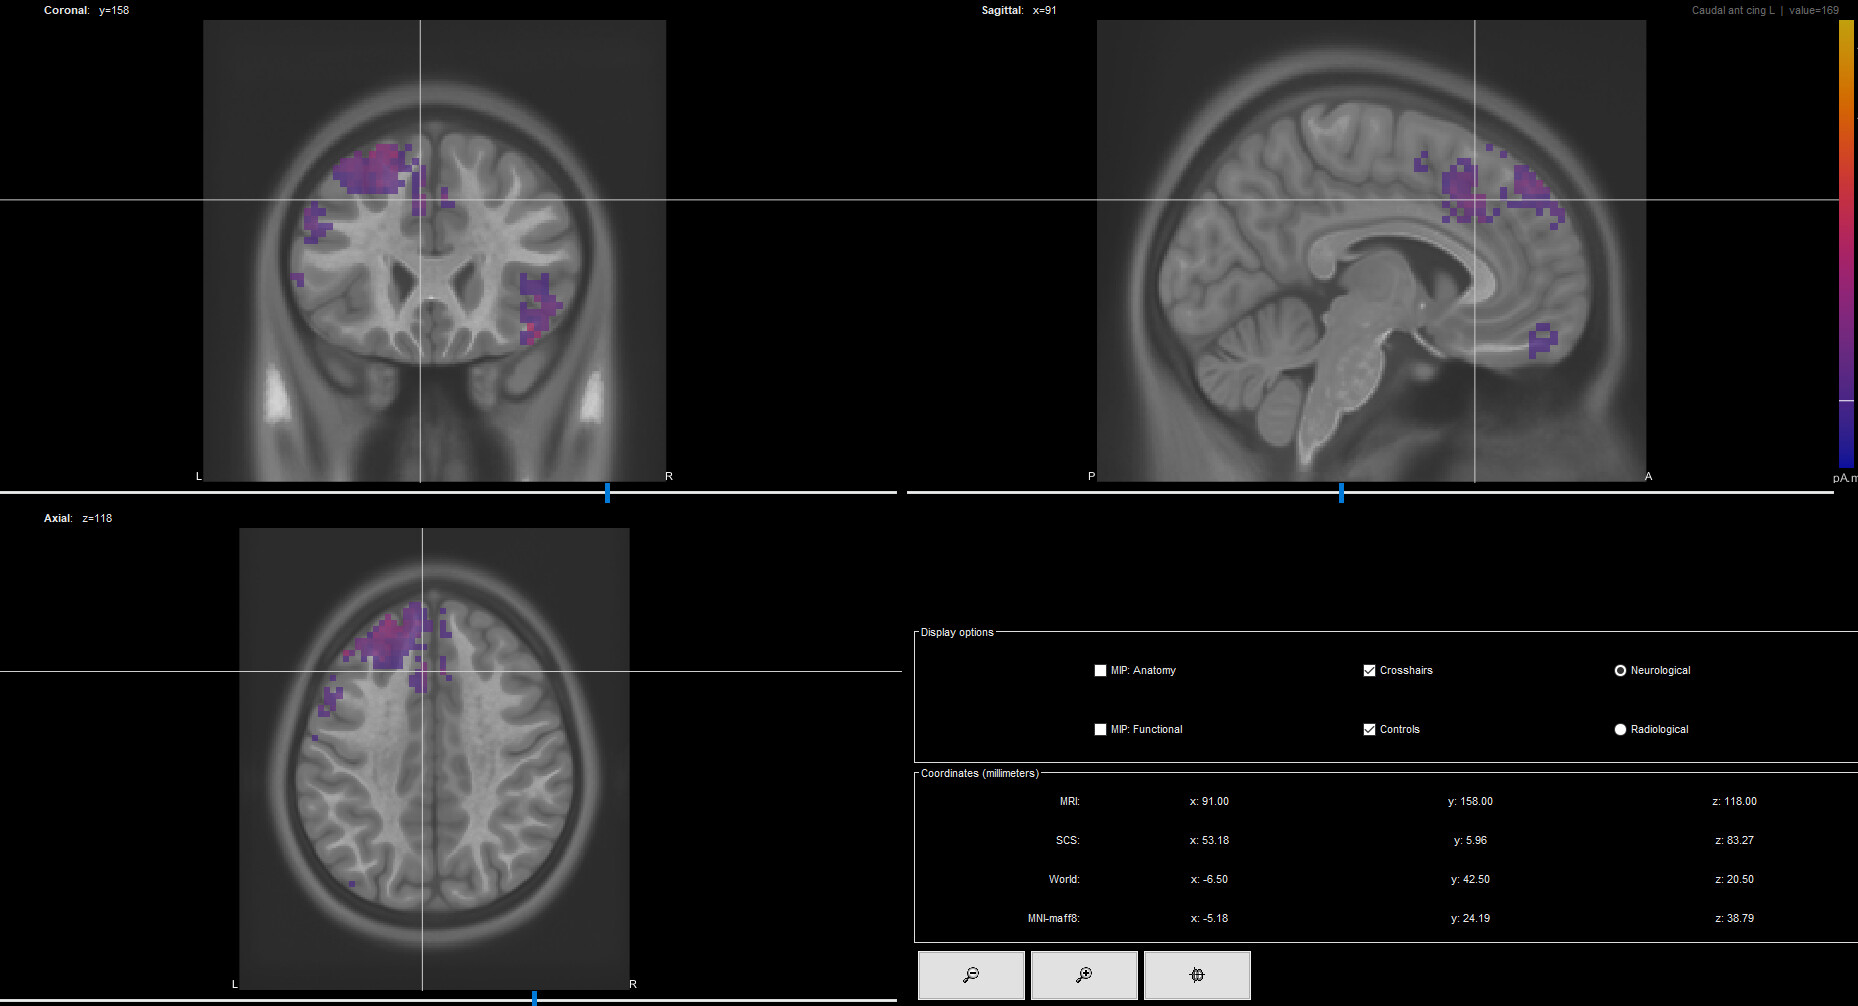
Am I doing something wrong? Also, I would expect the relative current density map to be displayed in the 3 orientations, is that the case?
Are there any other ways I can look at the current sources and sinks relative to the anatomy using Brainstorm(or maybe even with another software)?
Many thanks for your help!
Kind regards,
Joyce