I am doing independent permutation tests on my sources scout and on my 29 subjects.Each subject has a individual cortex.
The permutation test goes well but the results come out as a matrix and not as a source map has explained in your tutorial.
So I cannot represented the results of the permutation tests on the cortex. I think it is because each subject has is individual cortex, I am right ?
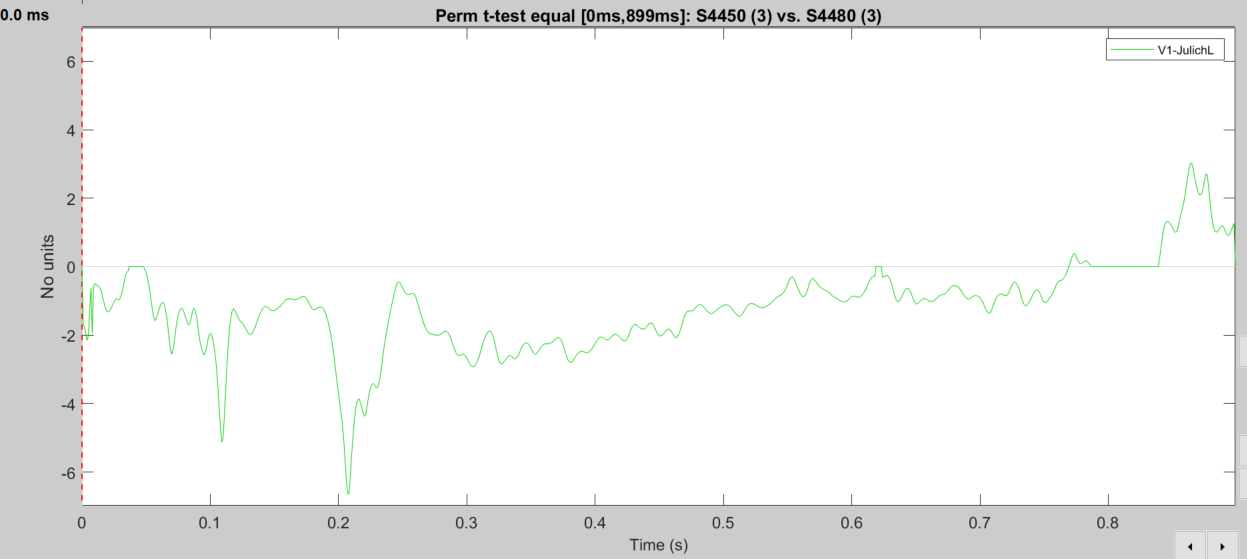
Another thing, when I display the results as time series, the y-axis is labelled as 'No units', so I wonder what is the y axis ?
Thank you for your response.I managed to do my permutation tests on sources between two conditions for a given scout. Now I want to do permutation tests on sources between two scouts for a given condition. Is it possible to do that ?
No, it is not possible do to this with the interface.
Comparing the min norm values between two different regions is not necessarily meaningful: testing that one region has higher values than another would mostly inform you about properties of the imaging technique that is used, not about the activity of the brain.
I have two matrix A and B of 26 subjects x 1200 times samples (one for each ROI) as input matrix. I don't understand what number I must put for the parameter dimPerm ?
I try to put 1, 2, 3 but each time I have an error.
I try through the interface by putting breakpoints but it didn't help me solve my problem.
I don't understand what number I must put for the parameter dimPerm ?
In this variable, you must report along which dimension you concatenated the various repetitions.
I try to put 1, 2, 3 but each time I have an error.
I guess the previous comment should help you solve your problem.
For future bug reports: please include the full error messages you get when you report an error.