I have run permutation t-tests on connectivity matrices (PLV NXN) in condition A and B. I would like to display positive t values (increased connectivity, is this right?) and negative ones (dereased connectivity) in condition B with respect to A. Files of A were put in the right window of process 2, and files of B in the left one. My t values range from -14 ; 14
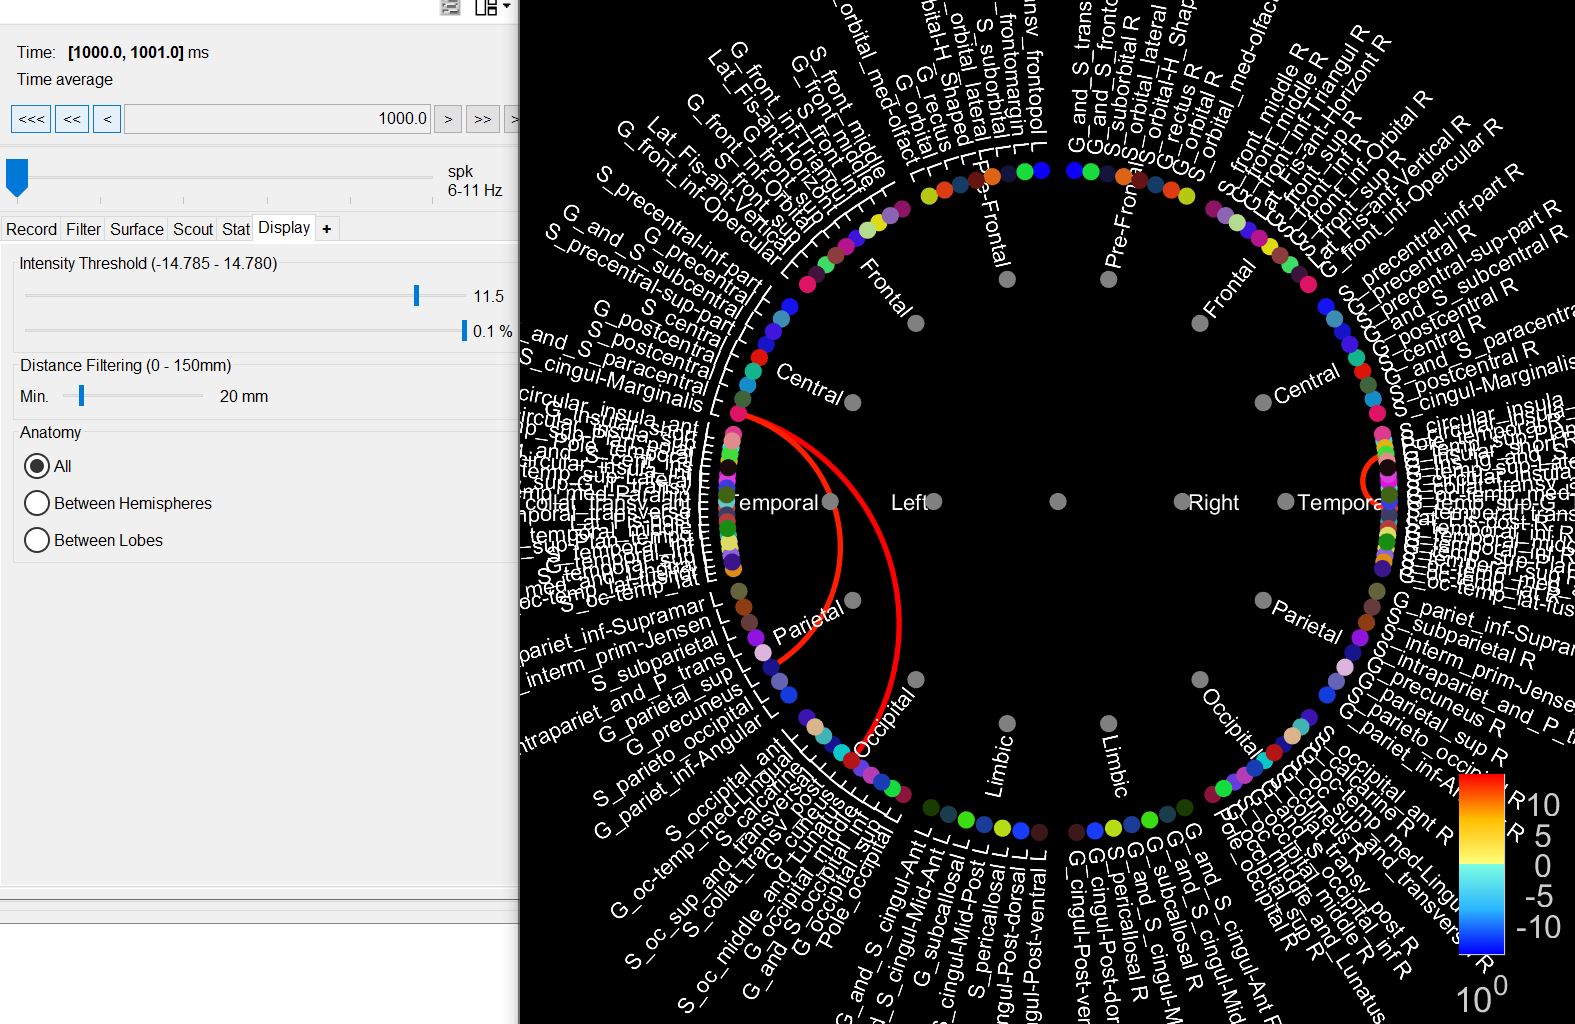
I can easily visualize significant positive values
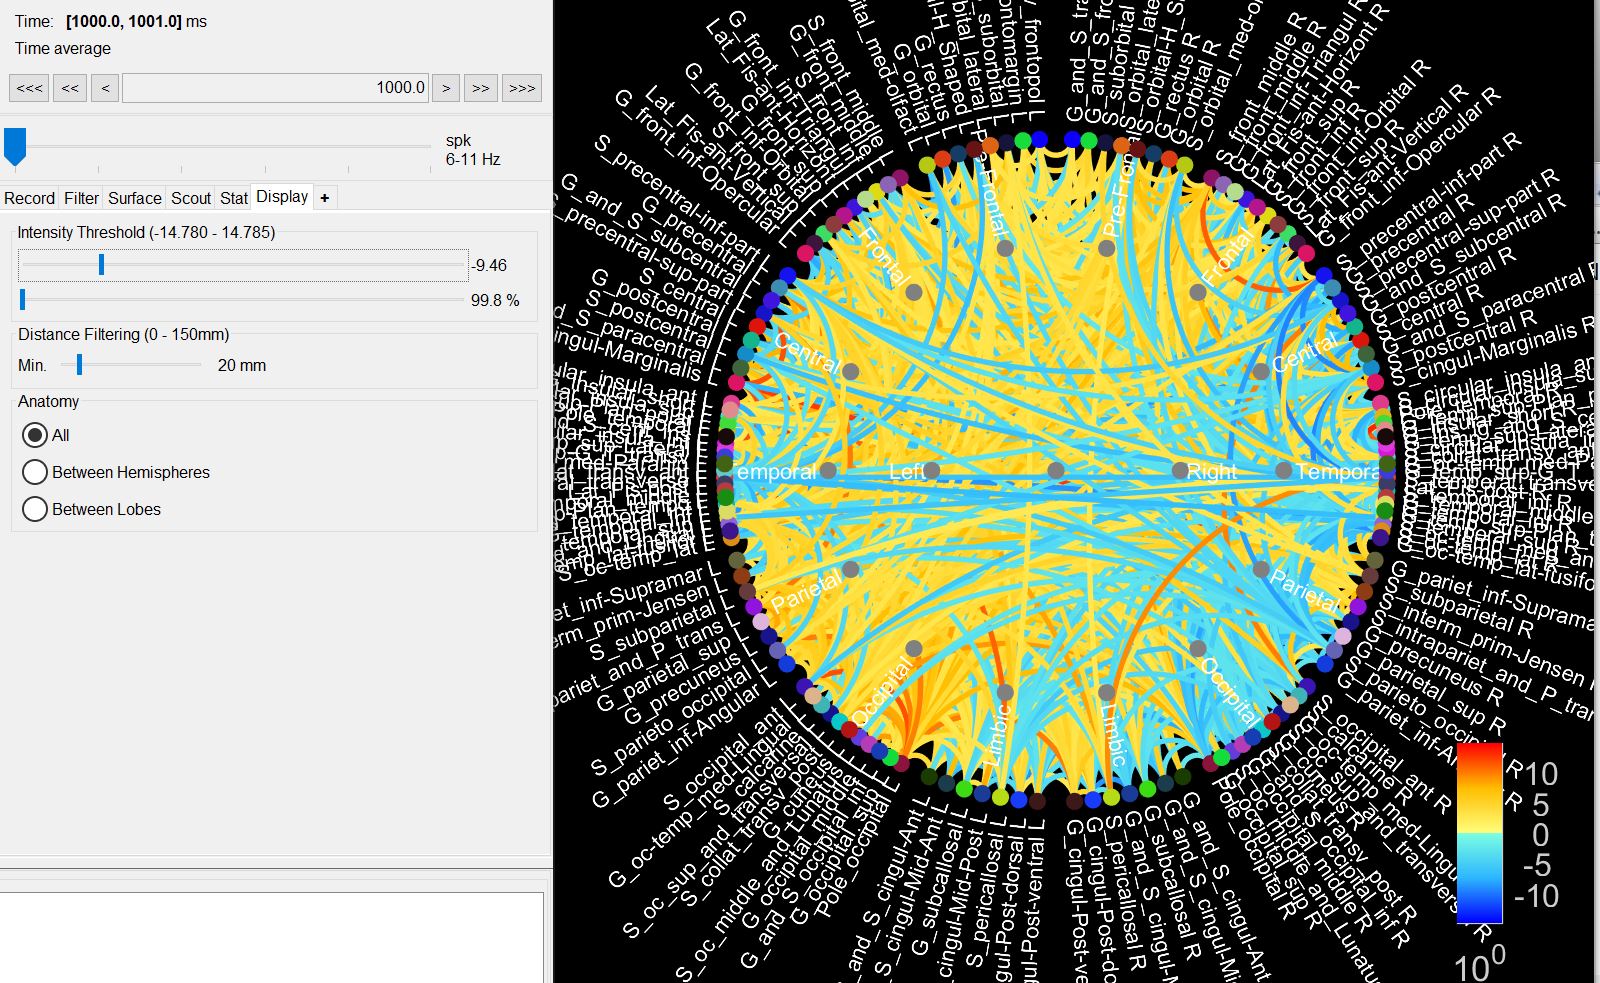
but when I try to slide the intensity threshold toward negative values, the percentile automatically slides too and the graph displays all t values. I tried a custom range (-14; -12) but it does not work either.
This phrasing is a bit confusing as the left box of Process1 is labelled FilesA, and the right is labelled FilesB.
But your interpretation is correct: If you put your condition B in FilesA (left) and condition A in FilesB (right), a positive t-value means B>A.
but when I try to slide the intensity threshold toward negative values, the percentile automatically slides too and the graph displays all t values. I tried a custom range (-14; -12) but it does not work either.
There might be other unwanted side effects to the changes I made, or other parts in the code where I should disable these filters. If you see any other behaviors of the interface that you don't understand, please let me know.
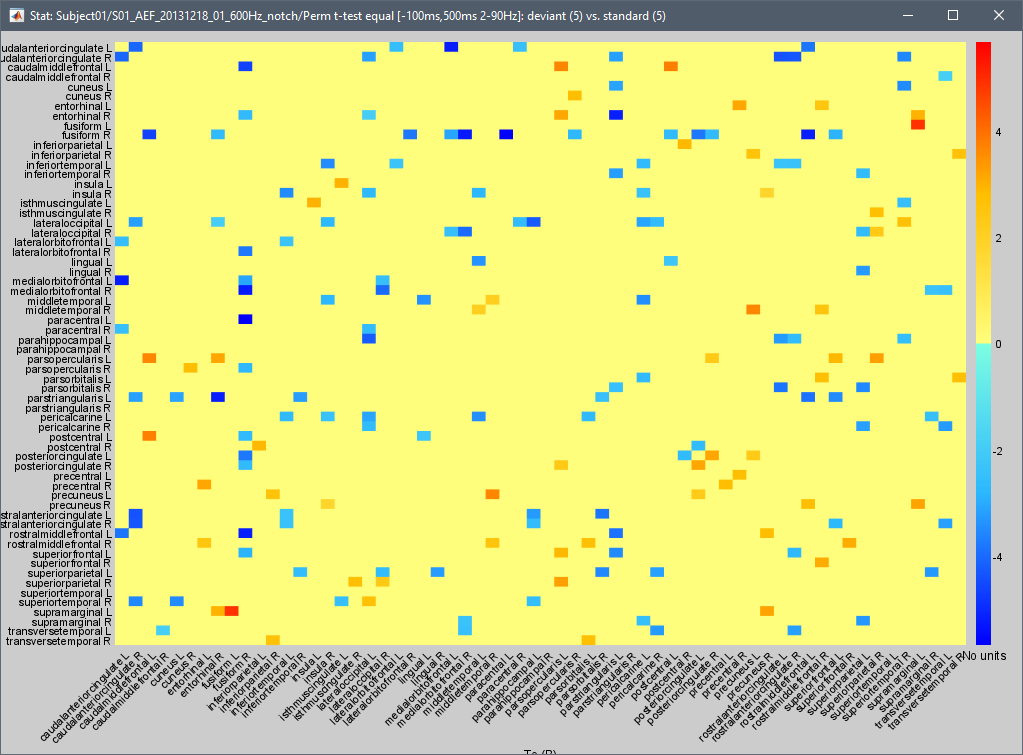
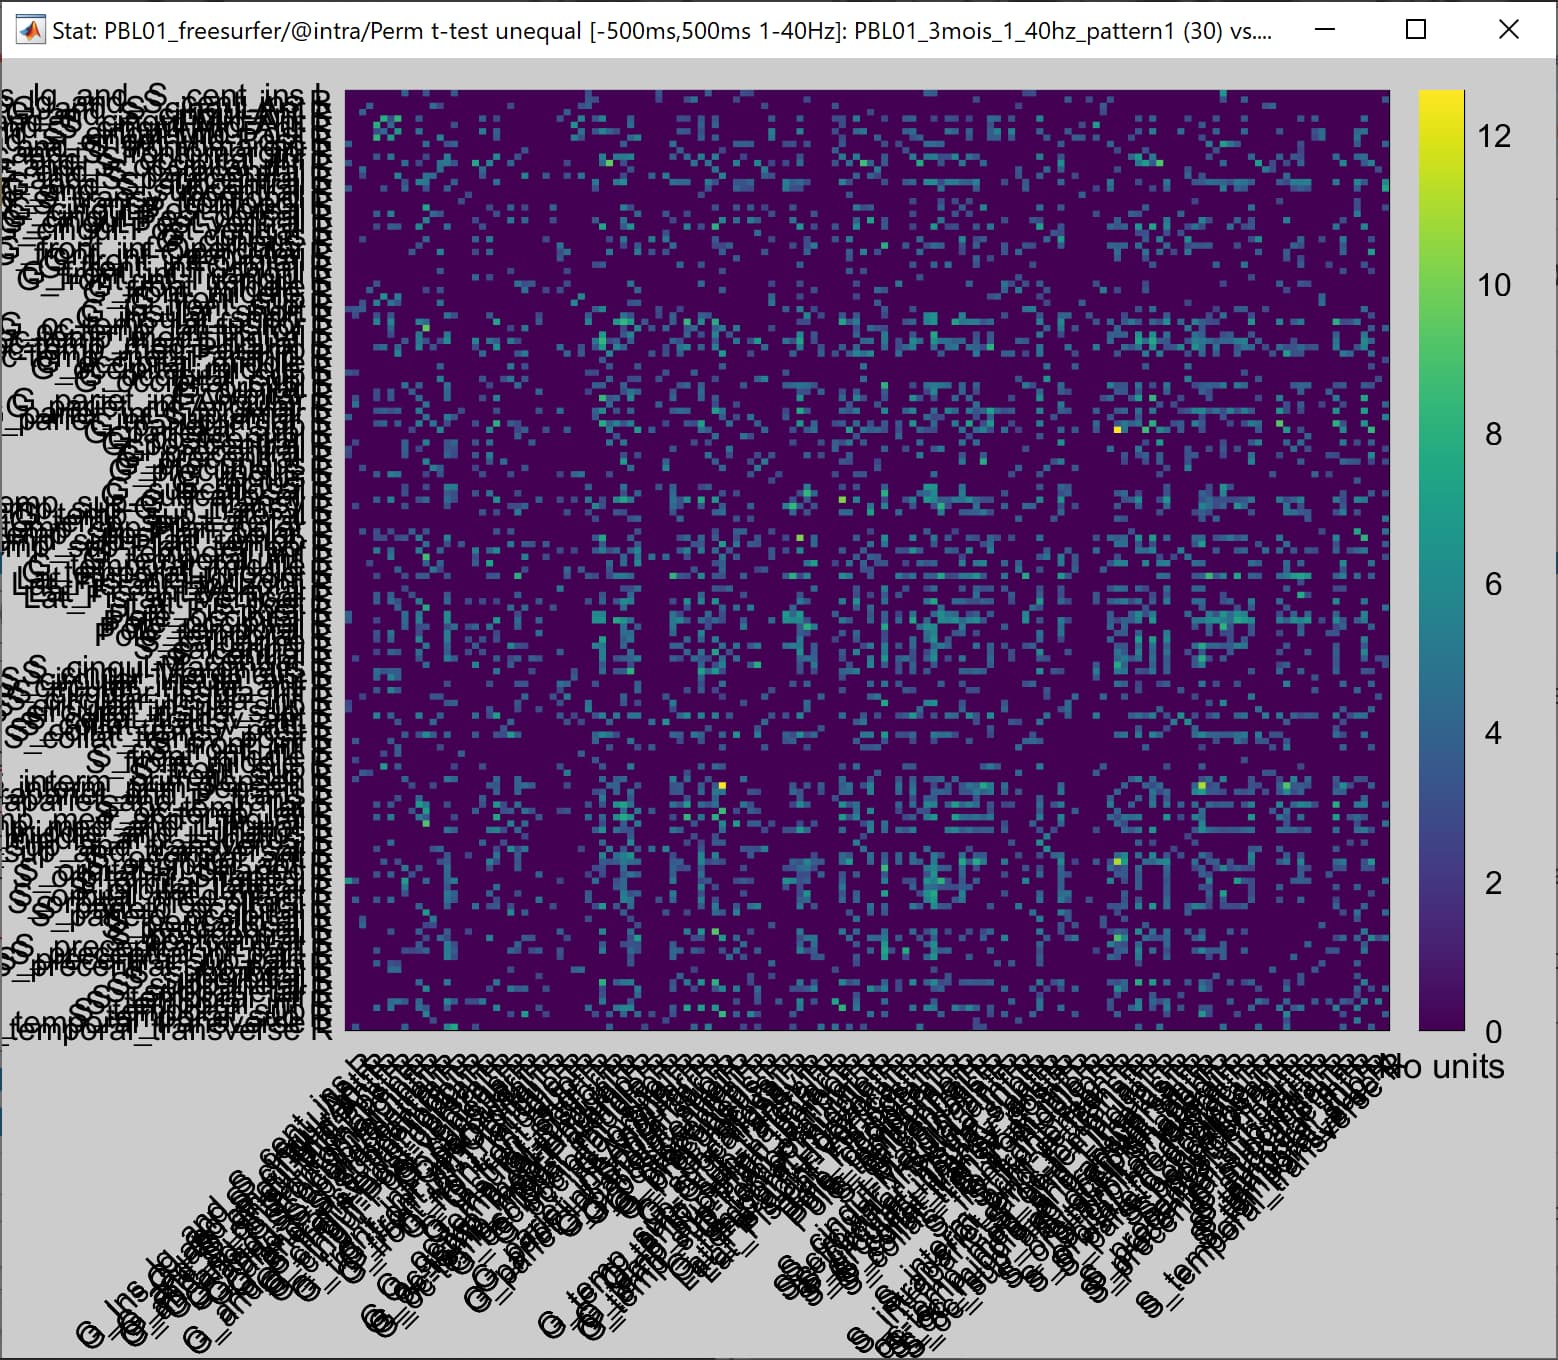
If you are not confident on the results or their interpretation as a circular graph, always refer to the connectivity matrix as displayed with the menu "Display as image".
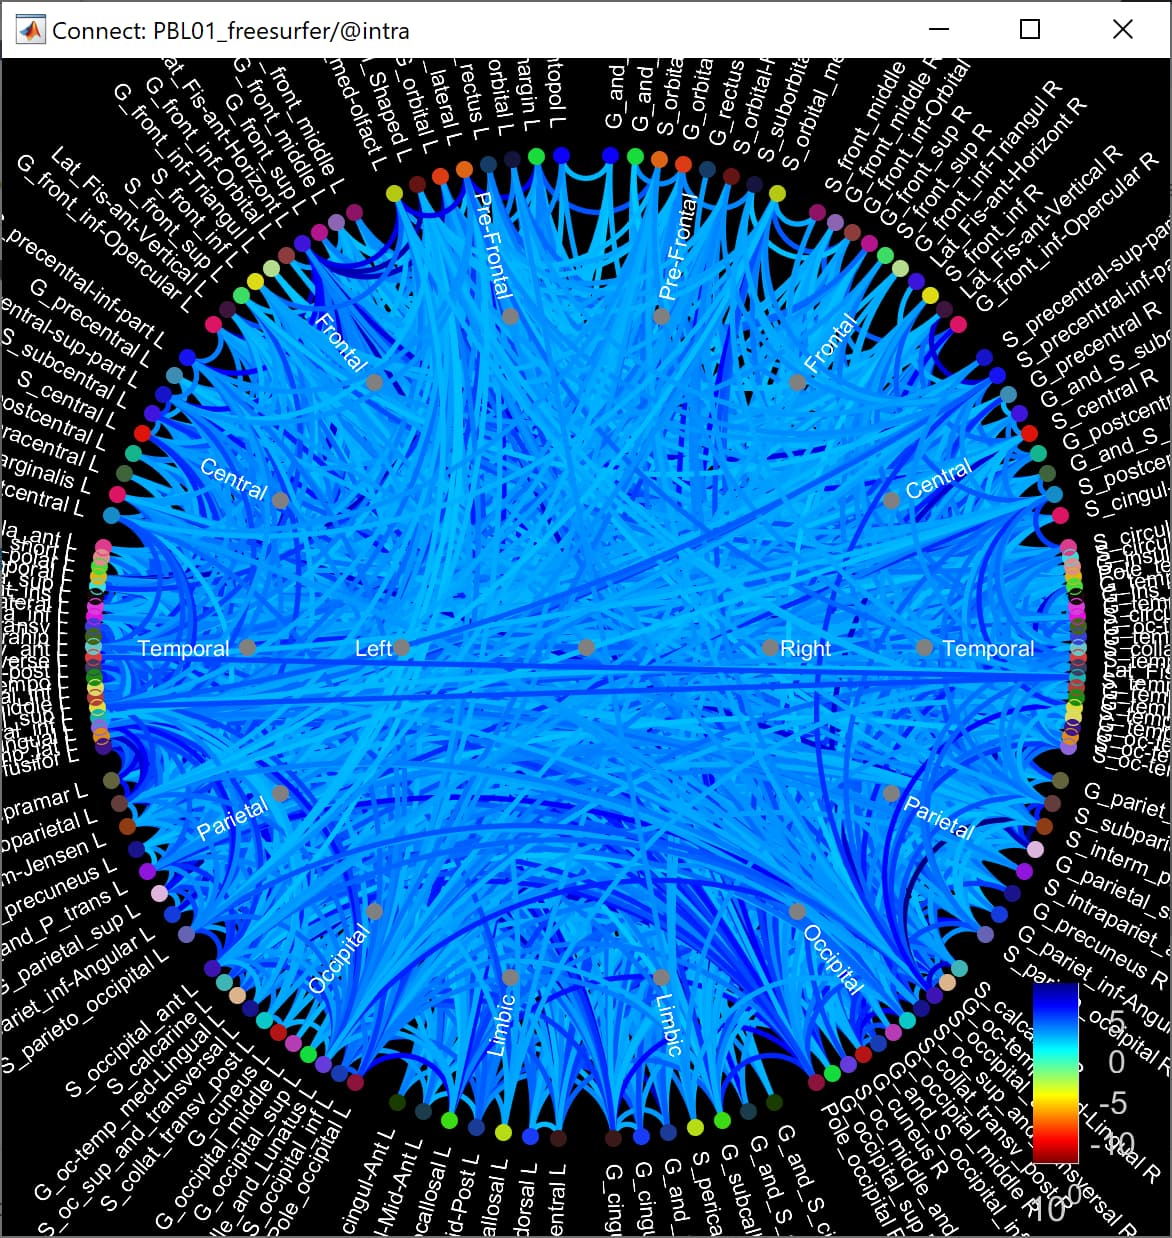
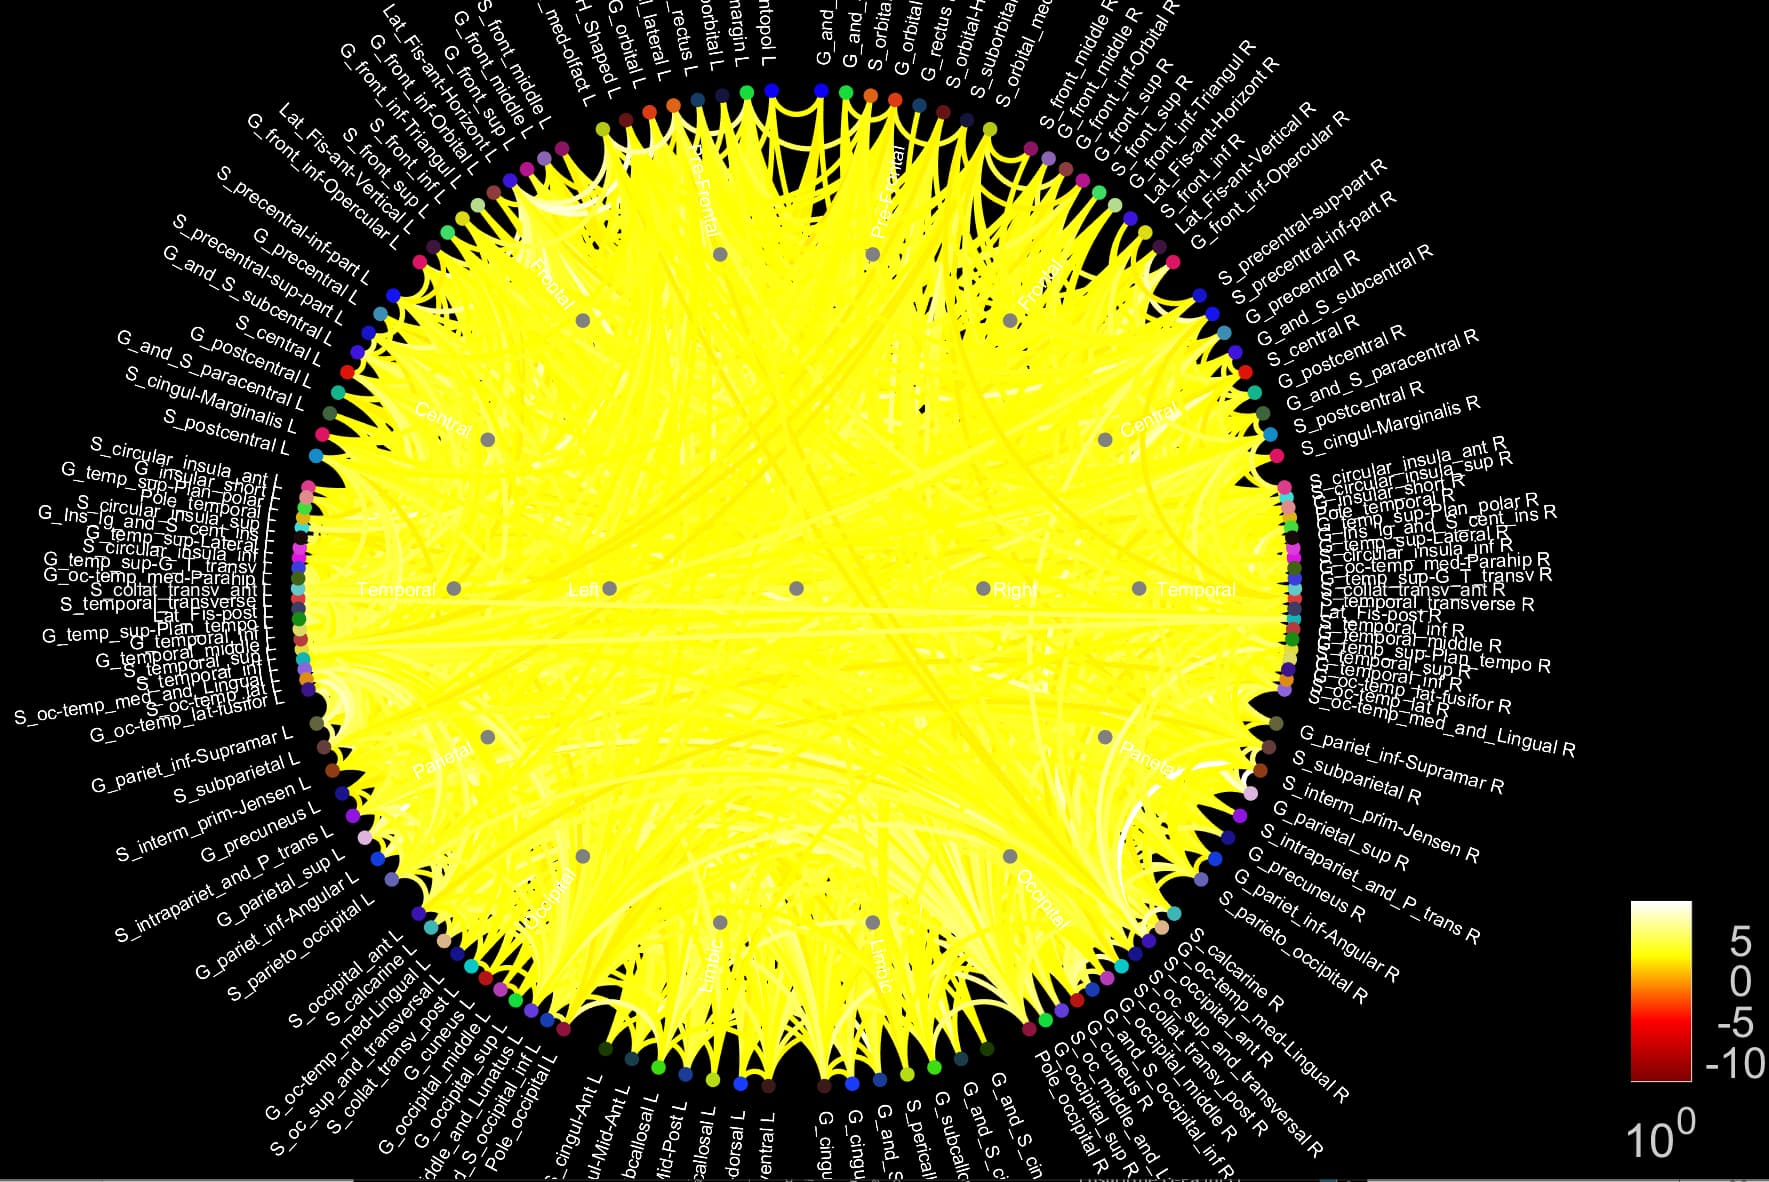
Thank you François, I appreciate you took some time to answer. Really. Well I downloaded the last version and indeed, there is no more display tab. However, I get now a full connected statistical graph ( ). However, changes between my two conditions are pretty visually obvious on my PLV matrices .......I suppose maybe I should run these permutation graph on thresholded PLV matrices? But I don't see how to do that.
Hi Francois . Actually yes I did correct for multiple comparisons.unfortunatly i am no more at work but when i will be back I could compare permutation matrices obtained from the previous BSversion and the ones obtained with the new downloaded version. I will get back to you then. Thank you so much for your time. Best Isa
Getting back to my permutation tests. as I mentioned in July, after updating Brainstorm, the results of the permutation test (FDR corrected) returns a fully connected graph while I got a sparse graph before updating.
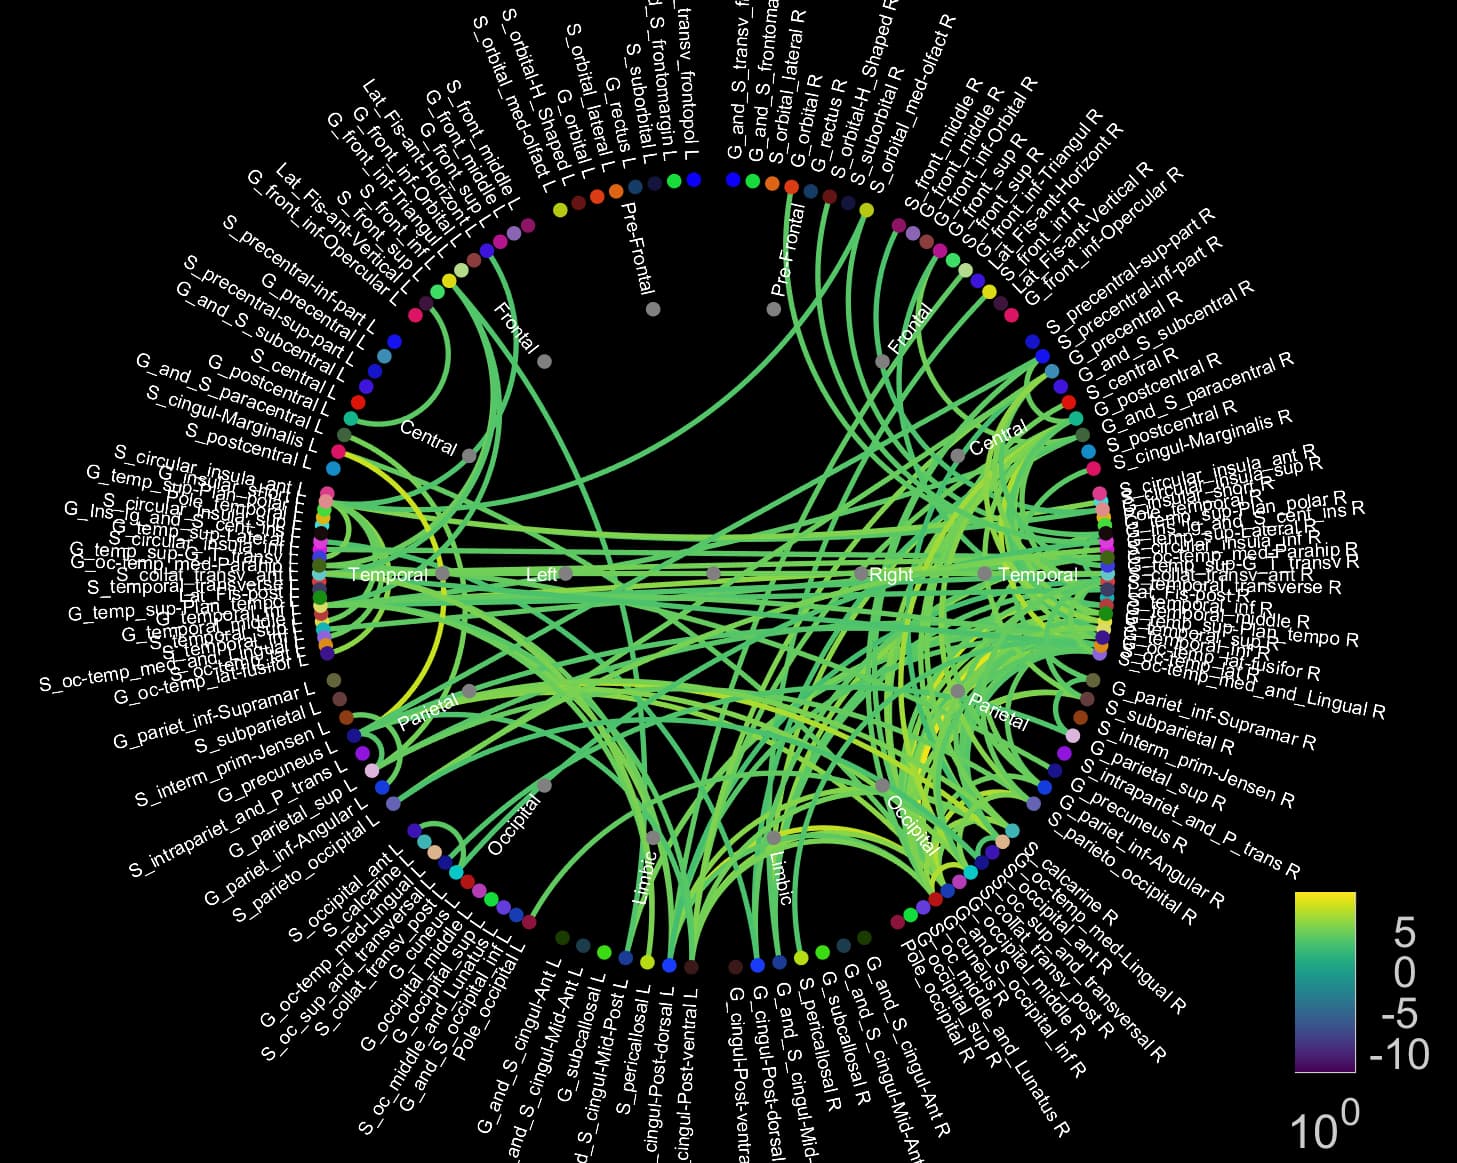
This is the graph obtained before the update (p <0.05)
Finally I have a last question : these graphes represent PLV values that are significantly higher in condition 2 as compared to condition 1, is this right? If yes, why are the values not between 0 and 1? (the range here on my graphes is between -12 and +12.
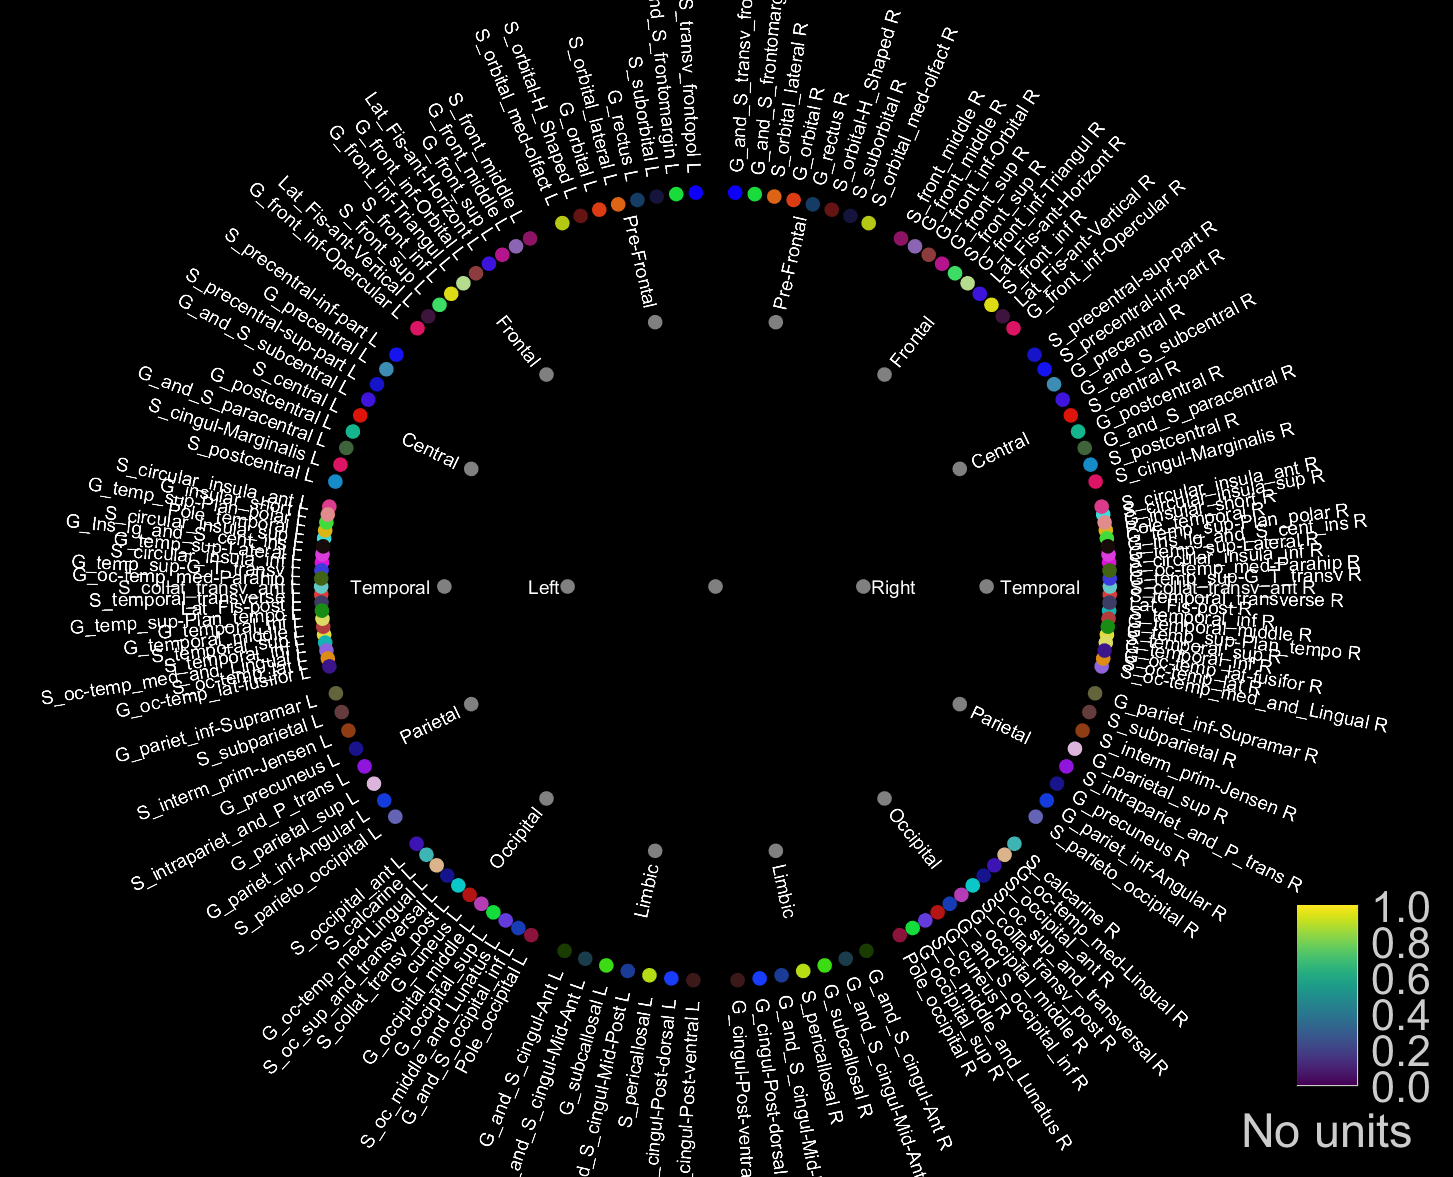
If you don't have any significant connection left with p<0.009, what are you expecting to do?
What do you mean with "threshold further"?
these graphes represent PLV values that are significantly higher in condition 2 as compared to condition 1, is this right? If yes, why are the values not between 0 and 1? (the range here on my graphes is between -12 and +12.
The PLV values are between 0 and 1.
The t-statistic can be between -12 and 12.
Depending on the file you open, you don't look at the same type of information.
I was just questionning myself about the fact that a large amount of significant connections appeared on the graphe at p 0.01, but non for a slightly lower p value (0.009).
My other concern is related to the difference in permutation graphes obtained before and after brainstorm update. Which one should I trust according to you?
Thanks a lot
If you think there is something suspicious here, please share your file and I'll have a look at it.
Upload your file somewhere and post the download link here.
My other concern is related to the difference in permutation graphes obtained before and after brainstorm update. Which one should I trust according to you?
I posted multiple fixes, so you should use the newest version.
There might still be bugs around, so be careful and do not trust blindly what you see.
I recommend you explore your data with the "Image" view instead of the circular graphs, it is easier to understand what is happening.