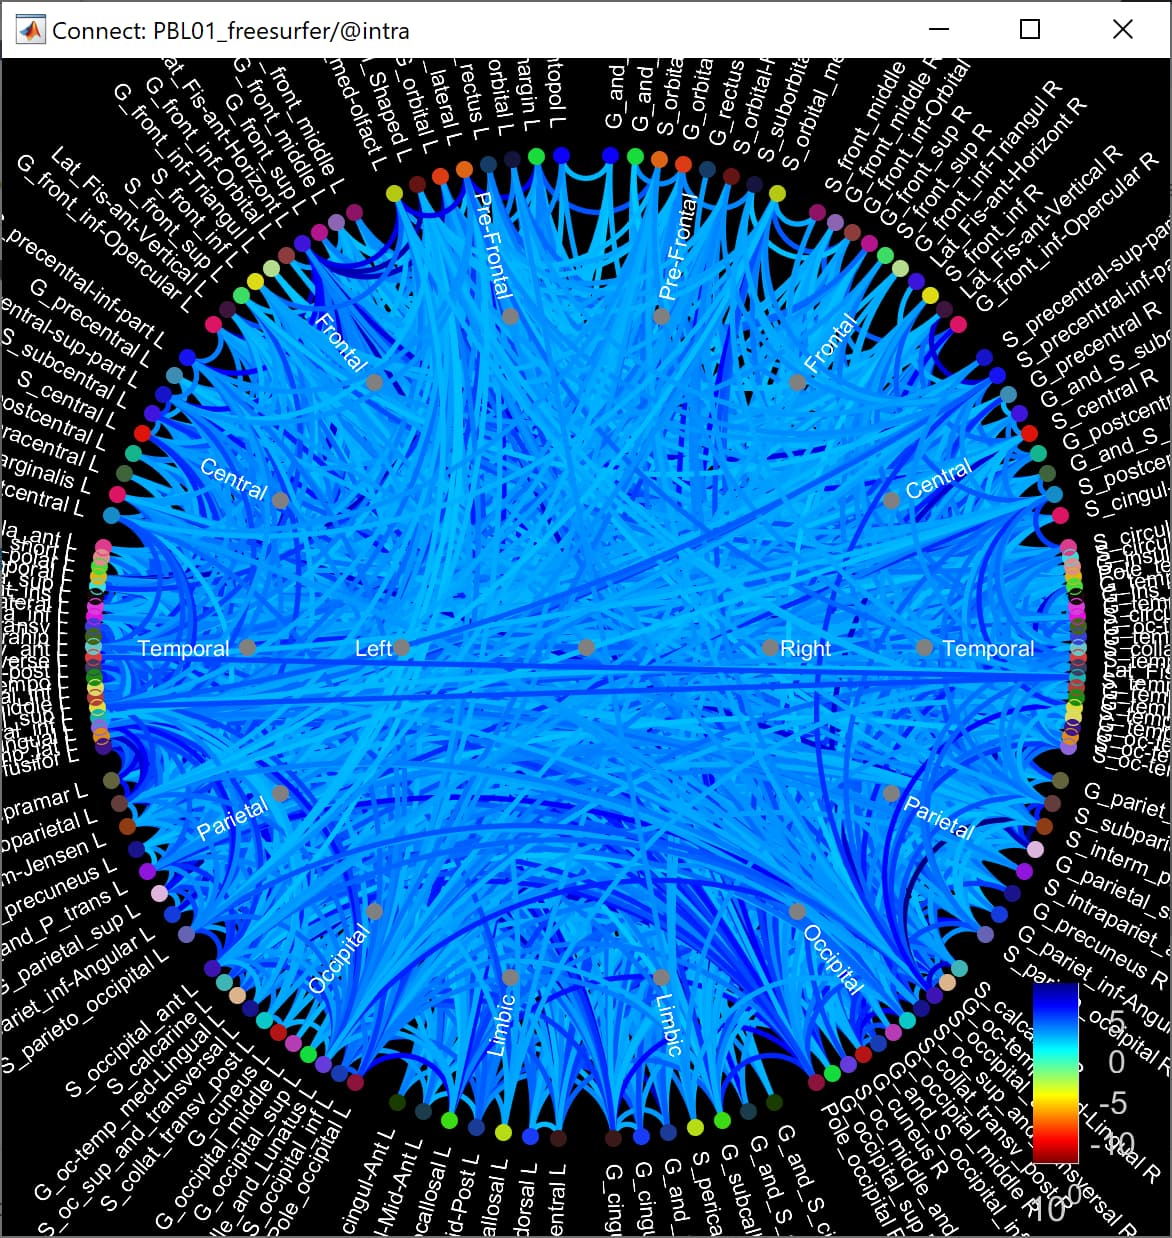
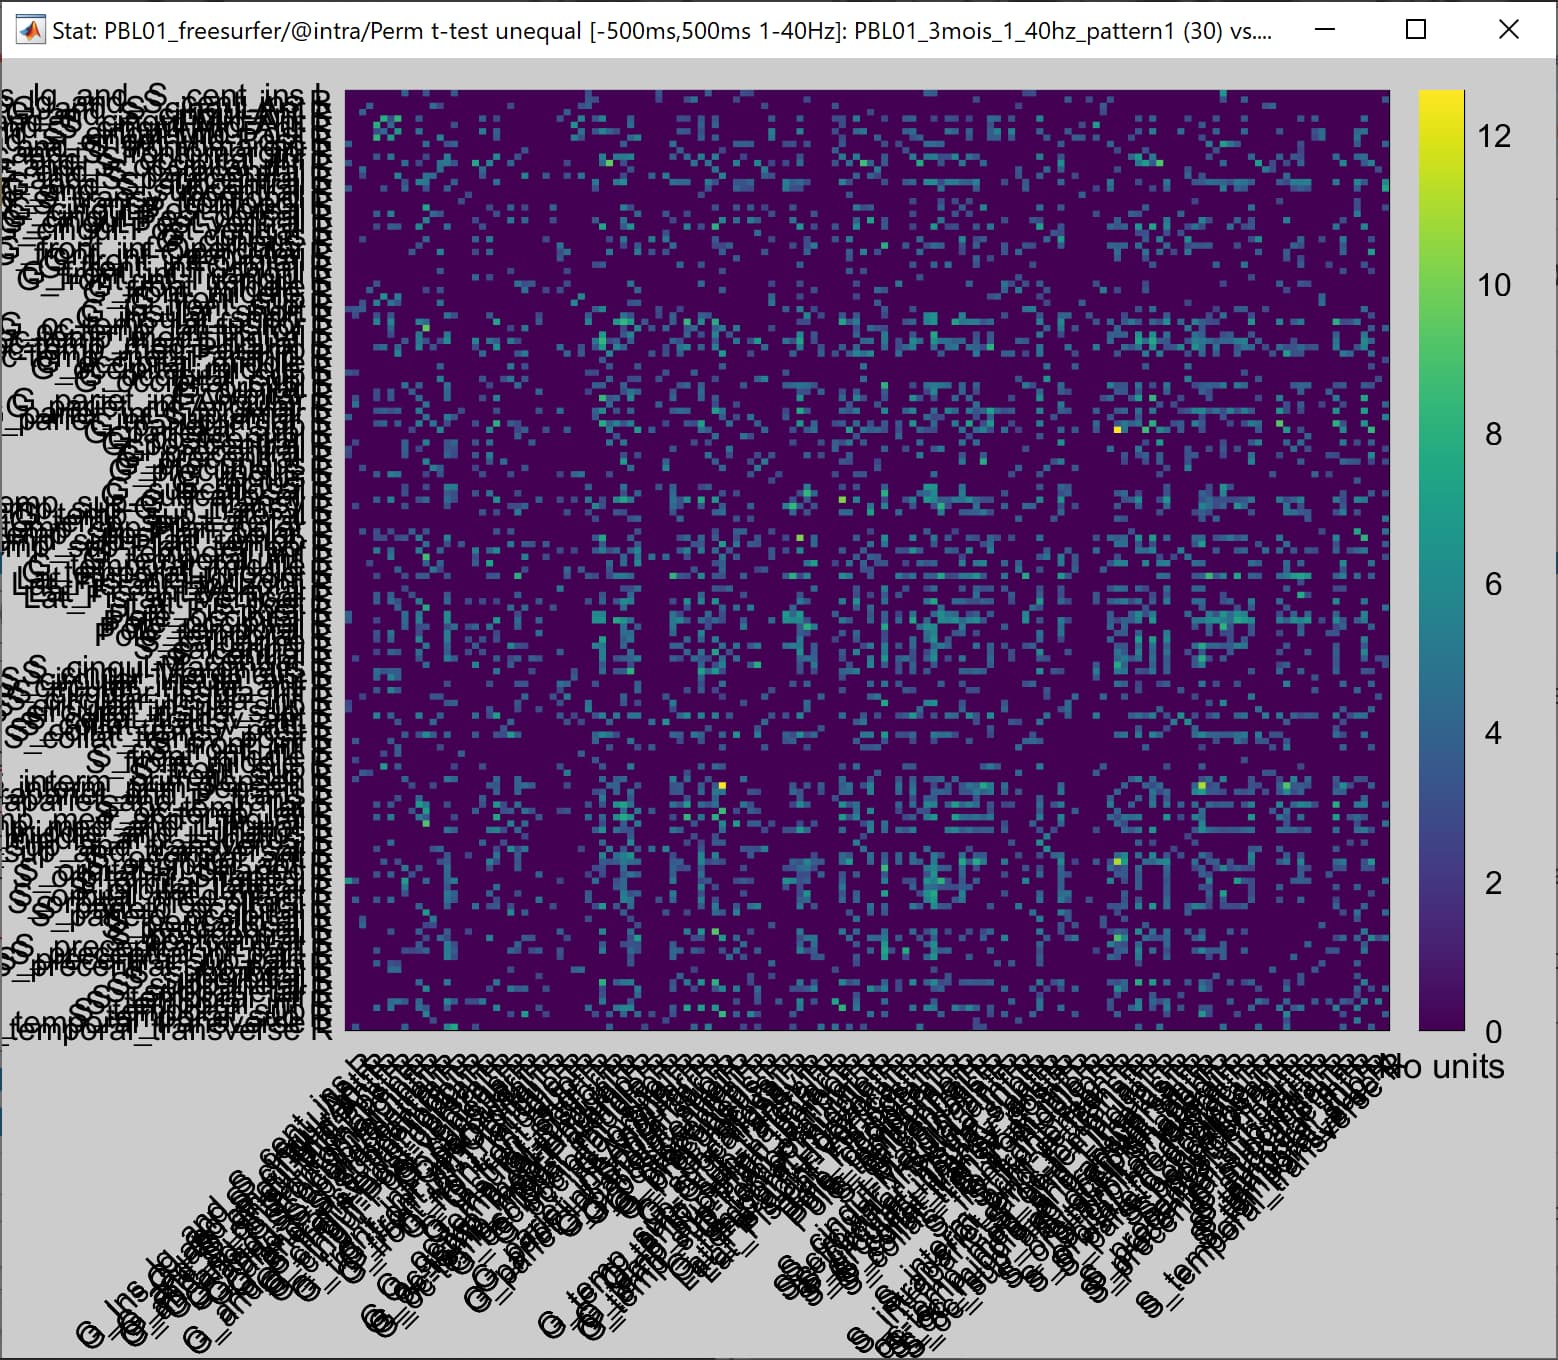
Thank you François, I appreciate you took some time to answer. Really. Well I downloaded the last version and indeed, there is no more display tab. However, I get now a full connected statistical graph ( ![]() ). However, changes between my two conditions are pretty visually obvious on my PLV matrices .......I suppose maybe I should run these permutation graph on thresholded PLV matrices? But I don't see how to do that.
). However, changes between my two conditions are pretty visually obvious on my PLV matrices .......I suppose maybe I should run these permutation graph on thresholded PLV matrices? But I don't see how to do that.
By the way , have a nice summer !
Isa