Hi,
I am analyzing a set of resting state EEG data containing 10 patients and 10 controls. The data being analyzed is 60 seconds for each subject.
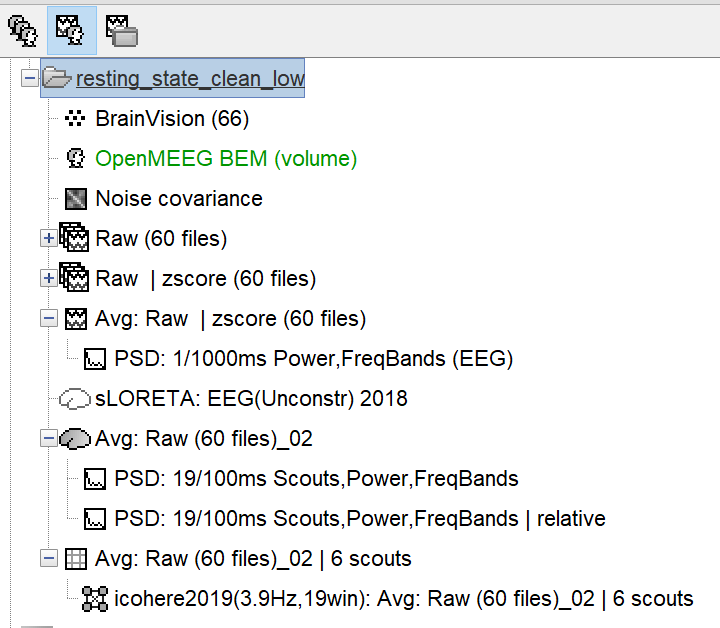
- All subjects have a default anatomy. To the cortex I had added the cerebellum and thalamus, as we are mainly interested in the cerebellum. I created a common file for the source grid containing 15235 voxels. Following this the head model was created using MRI volume and BEM and sources were computed using sLORETA for unconstrained sources. For source level statistics I took the subject source averages and then proceeded with a permutation test (Independent).
- Then for functional connectivity as we only wanted to look at connectivity between specific brain regions, I extracted-scout time series, from the subject source average file, and then computed the functional connectivity based on coherence. The coherence is calculated for multiple frequencies in the range of 1-30 Hz. And I proceeded with grouping the frequencies in frequency bands, as we are interested in connectivity for specific frequency bands.
I wanted to clarify:
• Is this pipeline ok?
• Secondly do I need to normalize the source averages? And for functional connectivity do we normalize as well?
• For functional connectivity done for specific scouts how should I do the group level statistics?
• For visualization of the functional connectivity results how can I get MRI maps? As of now I can only visualize these results in the time series, image and table format.
(I have attached a screen shot of the sensor level and source level pipeline for 1 subject)
Thank you so much!
Ami
Hi,
We are currently trying to investigate the resting state functional connectivity differences between patients and controls, specifically functional connections between the cerebellum and cortical regions.
The source averages of each subject refer to the 60 source files averaged for the 60 raw data files.
Thank you!
Because this is resting-state and not task, event related data, you don't want to average the files before computing connectivity. Instead, run the connectivity derivations on each raw (albeit cleaned, preprocessed) file and average them across the 60 epochs. You can also compute coherence measures across all 60 files at once as Brainstorm's connectivity processes can concatenate the files for you automatically in the background.
Ok, thank you. So while computing the functional connectivity for each raw file do I extract the the specific scout time series for the regions of interest and then compute the coherence or should I directly compute the coherence from the individual source files?
Once averaged over 60 epochs do I normalize the data?
Please consult the tutorial on connectivity, where this is all explained (the process GUI lets you pick the scouts you want to use, instead of running a whole-brain computation).
I am not sure what you mean by normalizing the data. Coherence is a measure bounded between 0 and 1.
Ok, thank you. I was wondering if the sLORETA source maps require any further standardization?
Maybe I'm missing your point but the coherence measure is a form of standardization in itself, bounding the outcomes b/w 0 and 1. So IMO, no need for another layer of standardization b/w subjects at this point. Please note we cannot provide guidance re: appropriateness of data analysis pipelines, because this pertains to the scientific question under study ; this needs to be discussed with your advisor, for instance. This forum is essentially to help Brainstorm users implement their chosen pipeline strategies, whenever possible. Thank you for your kind understanding and for using Brainstorm!
Thank you so much for your help!