Hi,
I need help.
I wanted to calculate epileptogenicity maps using only EEG (and not SEEG), but apparently this can't be done.
Could you please let me know why, and if there are any alternatives.
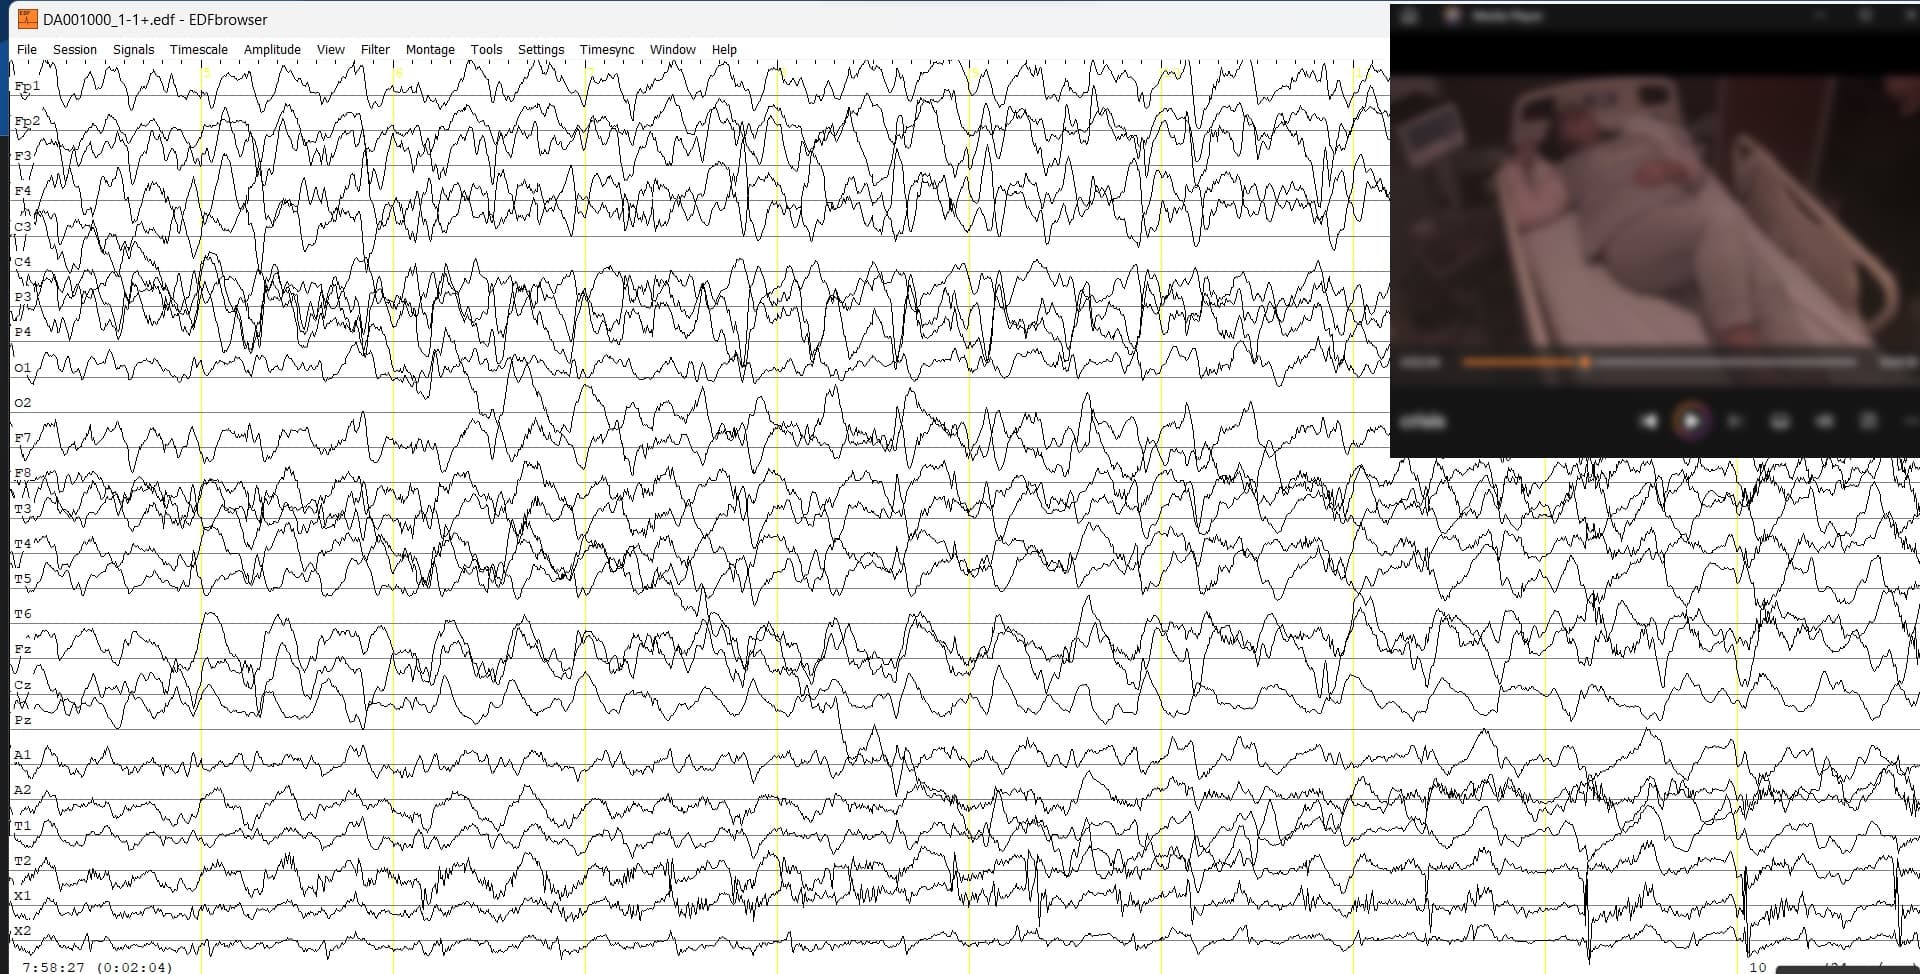
*My final goal would be to create a video showing the EEG, the patient, and the epileptogenicity progression.
Your help would be greatly appreciated 
Cheers,
Marco
Indeed, the methods used in the tutorial SEEG epileptogenicity maps are based on the SEEG signal properties as reported here:
Imaging the seizure onset zone with stereo-electroencephalography, (David 2011).
You may want to check the tutorial on non-invasive EEG and epilepsy, where (EEG-based) source estimation is used to identify the primary epilepsy focus:
https://neuroimage.usc.edu/brainstorm/Tutorials/Epilepsy
Dear Raymundo,
Thank you for your reply.
I've gone through the non-invasive EEG and epilepsy tutorial before, and the features explained there are great, but not necessarily what I am looking for.
Rather than analyzing interictal activity (such as spikes), I am trying to visualize epileptiform activity progression in a patient presenting a focal, secondarily generalized, seizure.
Something like this : https://youtu.be/1jpmc1Sl6OE but also including the video of the patient.
Do you think this can be achieved somehow?
Gracias!
Marco
Hi @MLisicki
This video is realized with Brainstorm, so you can reproduce similar with you own data.
You can also check the video that Raymundo share here: https://www.youtube.com/watch?v=I9iAPVvWhwA
he is showing how to do it at ~45min.
Thank you very much, @tmedani !
At one point, I considered this as a potential alternative. However, the need to advance the EEG using arrow keys (which may lead to desynchronization with the patient's video) and the absence of statistical comparisons (as for the t-tests were used in SEEG) discouraged me.
Anyways, I'll give it a shot and see how it goes. I'll keep you posted.
Cheers,
Marco
Are you using the Video-EEG synchronization option in Brainstorm?
It will works with EEG and SEEG recordings
https://neuroimage.usc.edu/brainstorm/Tutorials/Epileptogenicity#Video-EEG
Hey Raymundo,
Thanks for getting back to me about my question. Your help and input from @tmedani have really helped me move forward. But now, I'm stuck on one thing. The EEG time series display isn't updating as the video goes on (doesn't automatically move to the next 10s page). This is important because I want to watch the epilepsy activity develop in both the usual 2D way and also in 3D using Brainstorm's source reconstruction.
Got any ideas on how to fix this?
Thanks,
Marco
1 Like
Dear @Raymundo.Cassani and @tmedani,
I hope you are doing well.
I am getting back to you because I still haven't figured out how to make the EEG recordings in the time domain progress together with the video and cortical projections (like in a 10 s/page fashion).
Furthermore, although I have now been able to display real-time cortical activity during a seizure using LORETA and other tools, the results appear rather stroboscopic, contrasting with the smooth transitions presented in the SEEG video.
I thought this might be because t-values (as in the SEEG video) fluctuate less abruptly than voltage (as in EEG/Loreta).
In order to overcome this, and display results in a manner that is more easily interpretable for clinicians, I attempted to perform a cortical projection of time-frequency activity focusing on the spectrum where epileptic activity is chiefly occurring.
However, for some reason, after performing the Hilbert transform (following the time-frequency tutorial) I am unable to display results on the cortex, and trying to modify parameters in the omega tutorial hasn't got me very far either.
Finally, I've attempted to compute sources using MEM> wavelet representation, limited to a narrow band of the spectrum (the region of interest), but processing the data for a 1 min seizure takes forever.
Any ideas on how to overcome these issues?
Your help would be greatly appreciated.
Cheers,
Marco