Hello,
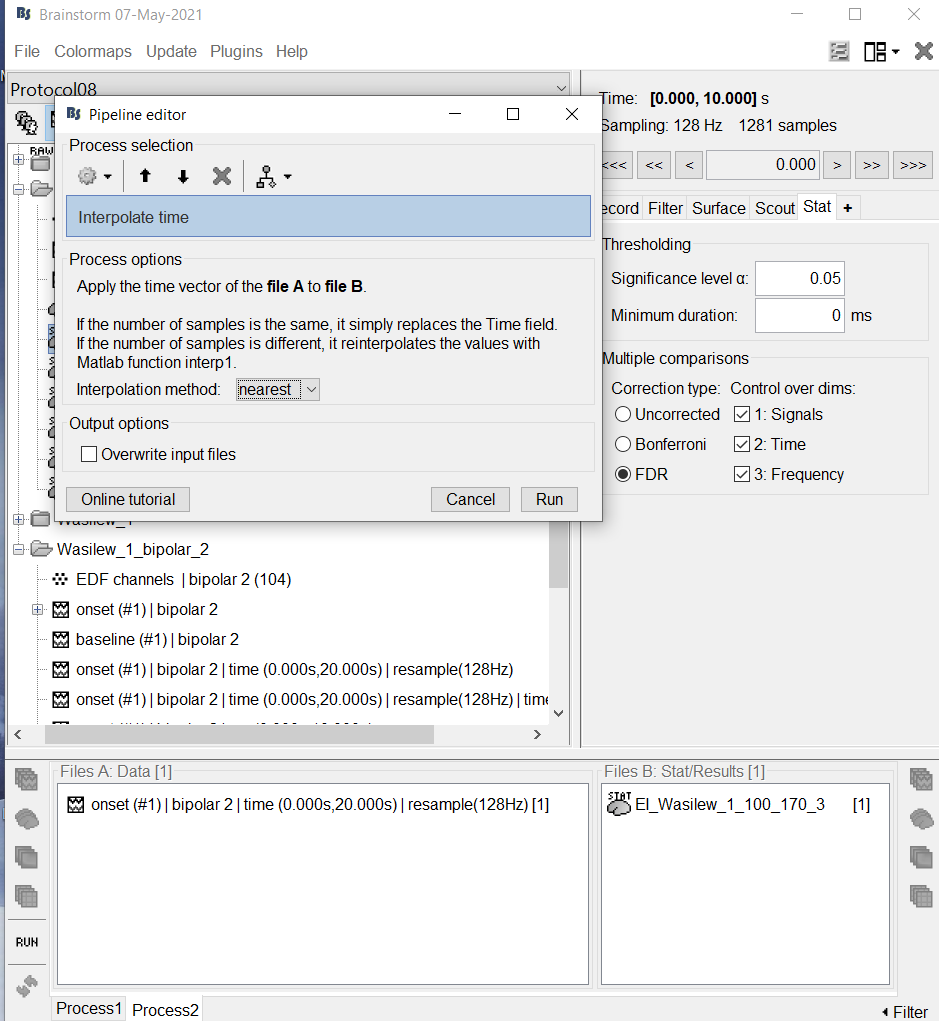
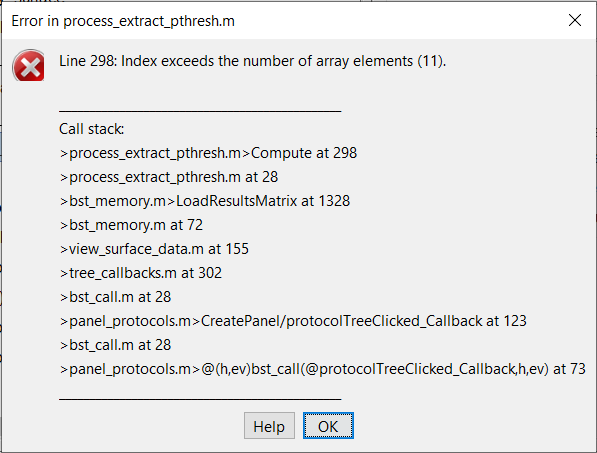
I am trying to process my data using your pipeline on epileptogenicity maps. Every time after time interpolation of the stat results I receive the same error (on the screenshot). How can I fix this?
Thanks in advance!
Hello,
I am trying to process my data using your pipeline on epileptogenicity maps. Every time after time interpolation of the stat results I receive the same error (on the screenshot). How can I fix this?
Thanks in advance!
Could you please share the file you are having issues with?
Thanks
Thank you for the details.
I realized that the pipeline had changed but was not updated in the tutorial.
It is not possible to run anymore the process "Interpolate time" directly on the stat files, you need to apply the threshold explicitly first.
I pushed some modifications to the software (get them by simply updating Brainstorm): https://github.com/brainstorm-tools/brainstorm3/commit/2a7d181aee1f089b01742818ff5a9d63267638e0
And I edited the documentation:
https://neuroimage.usc.edu/brainstorm/Tutorials/Epileptogenicity#Create_a_movie_with_the_SEEG_signals
Please let us know if you find anything that does not match between the documentation and the interface of the software.
Thanks
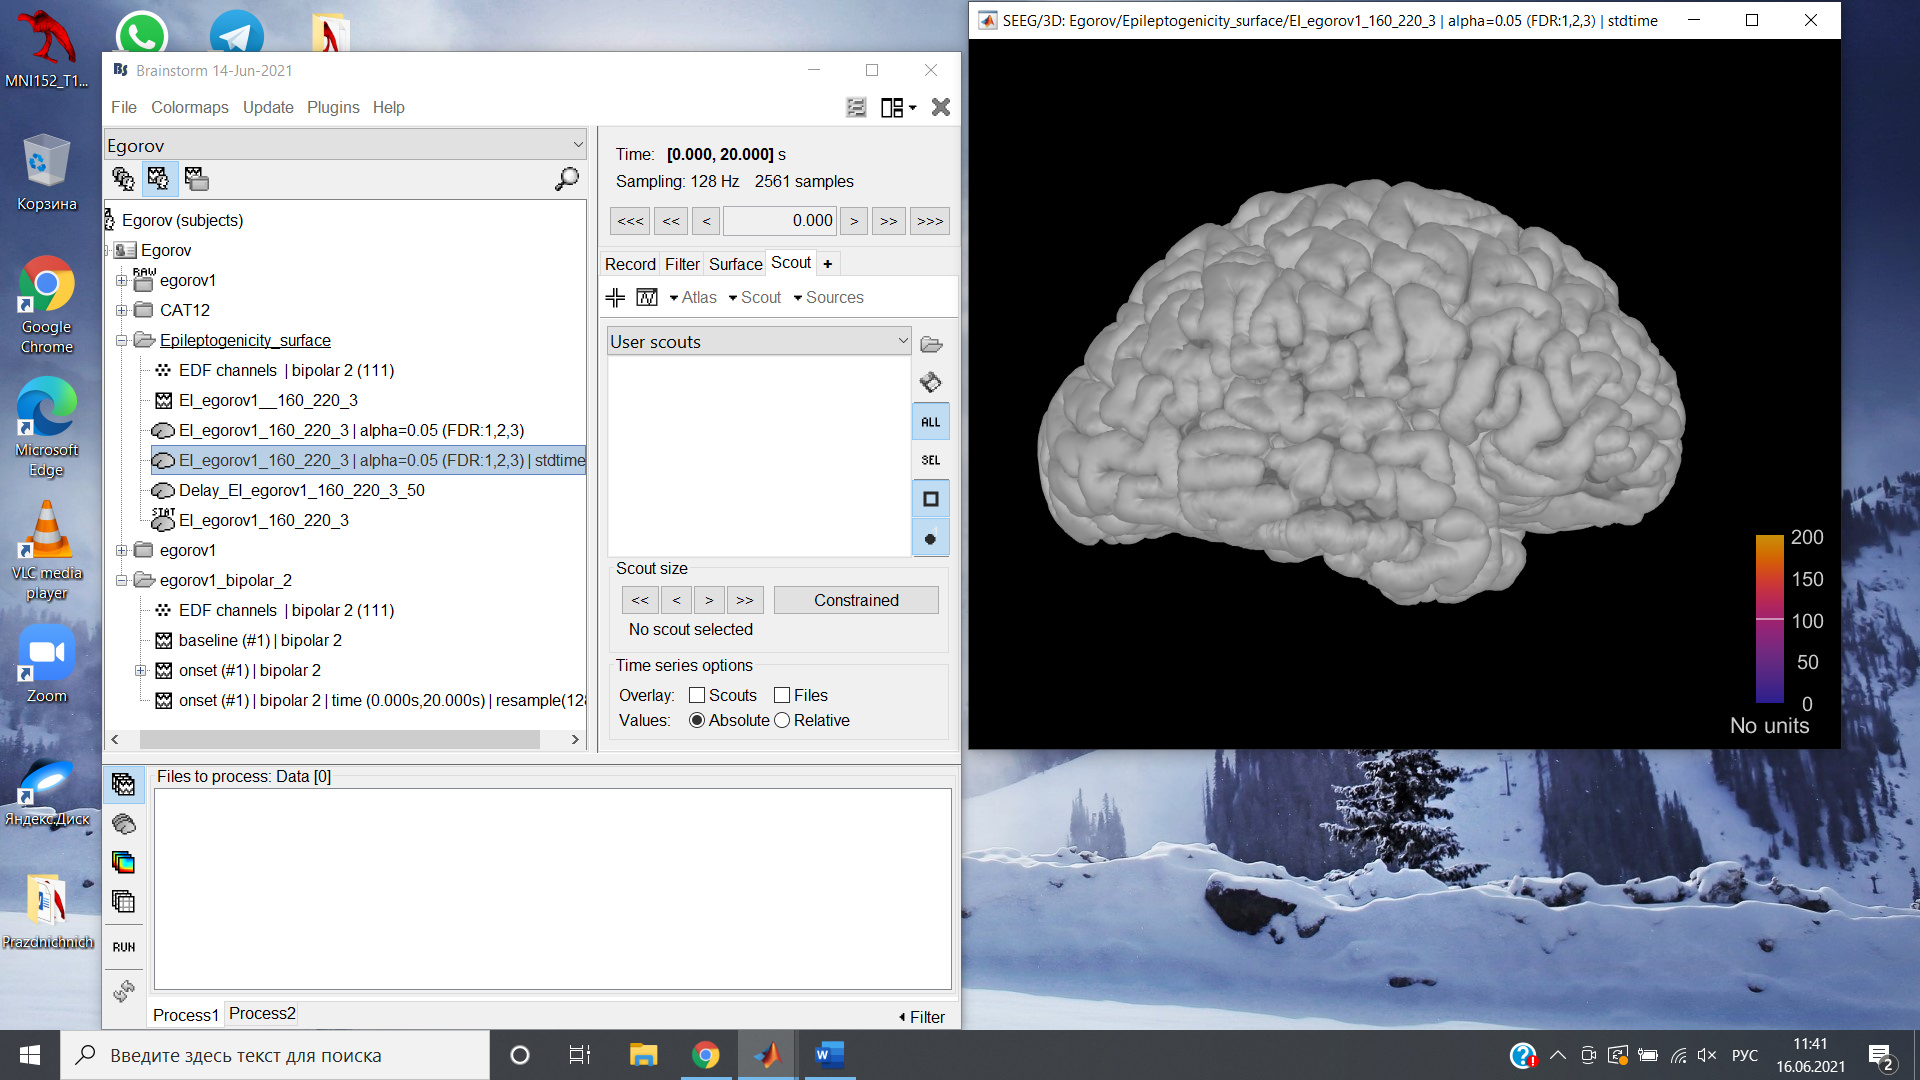
Thanks for the answer, I now can open the two files simultaneously, but the epileptogenicity map doesn't show the actual epilepsy, what could be wrong?
There are so many parameters involved and so many possible types of seizures, it is not possible to answer this question.
You should start by exploring your recordings as presented in the introduction tutorials or the EEG/Epilepsy tutorial:
https://neuroimage.usc.edu/brainstorm/Tutorials
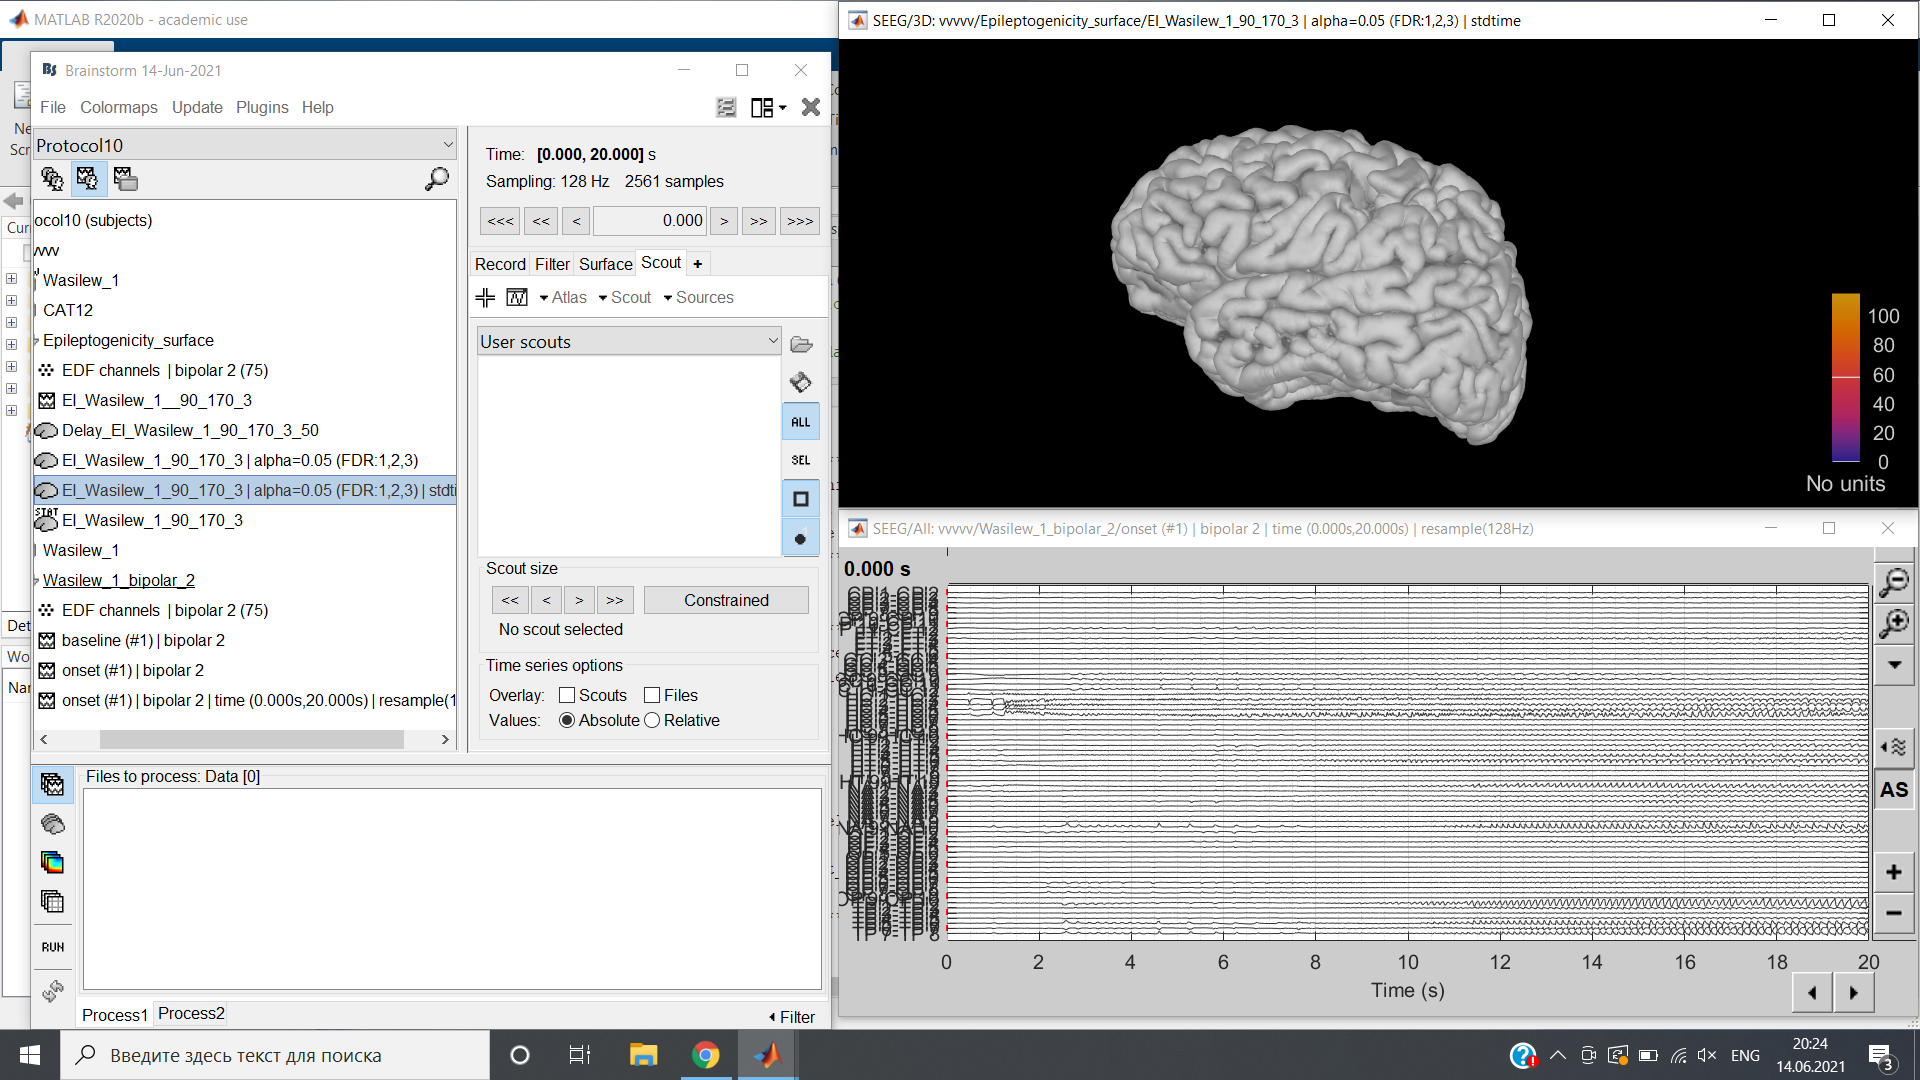
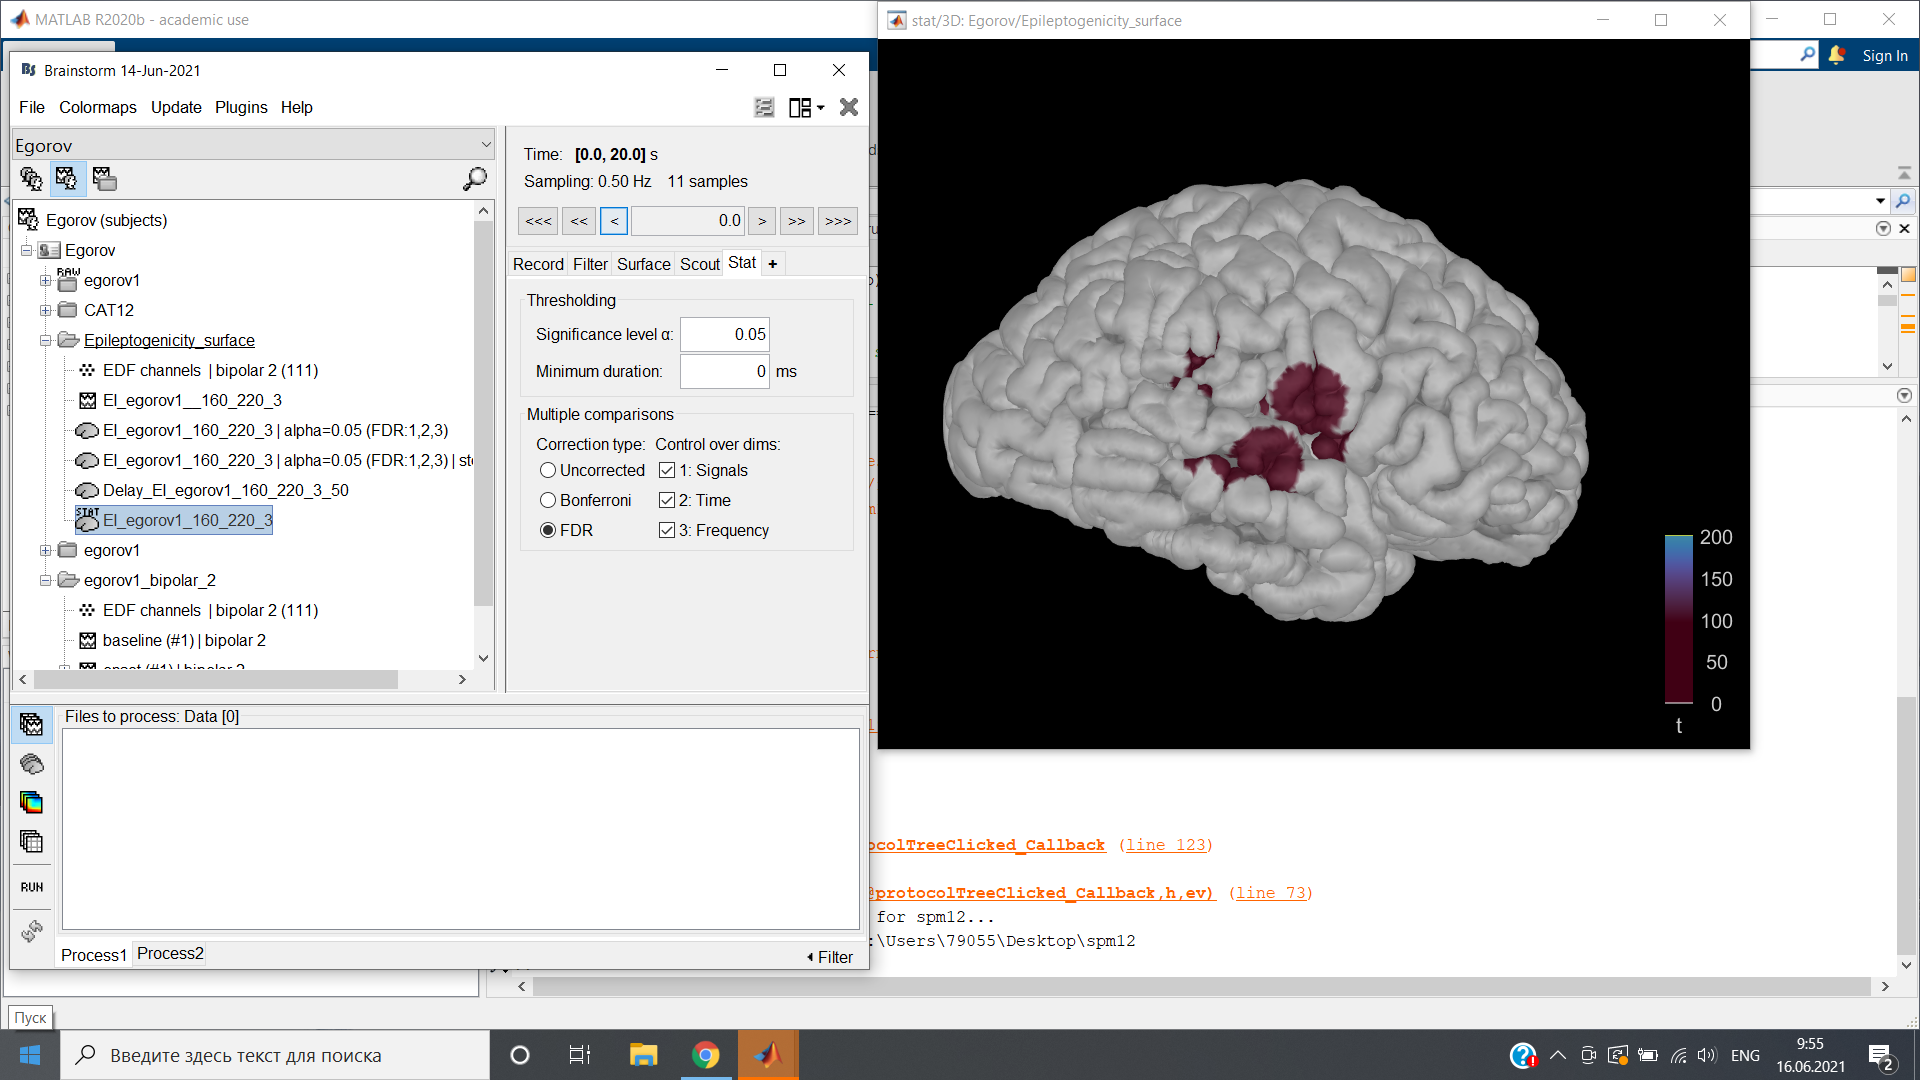
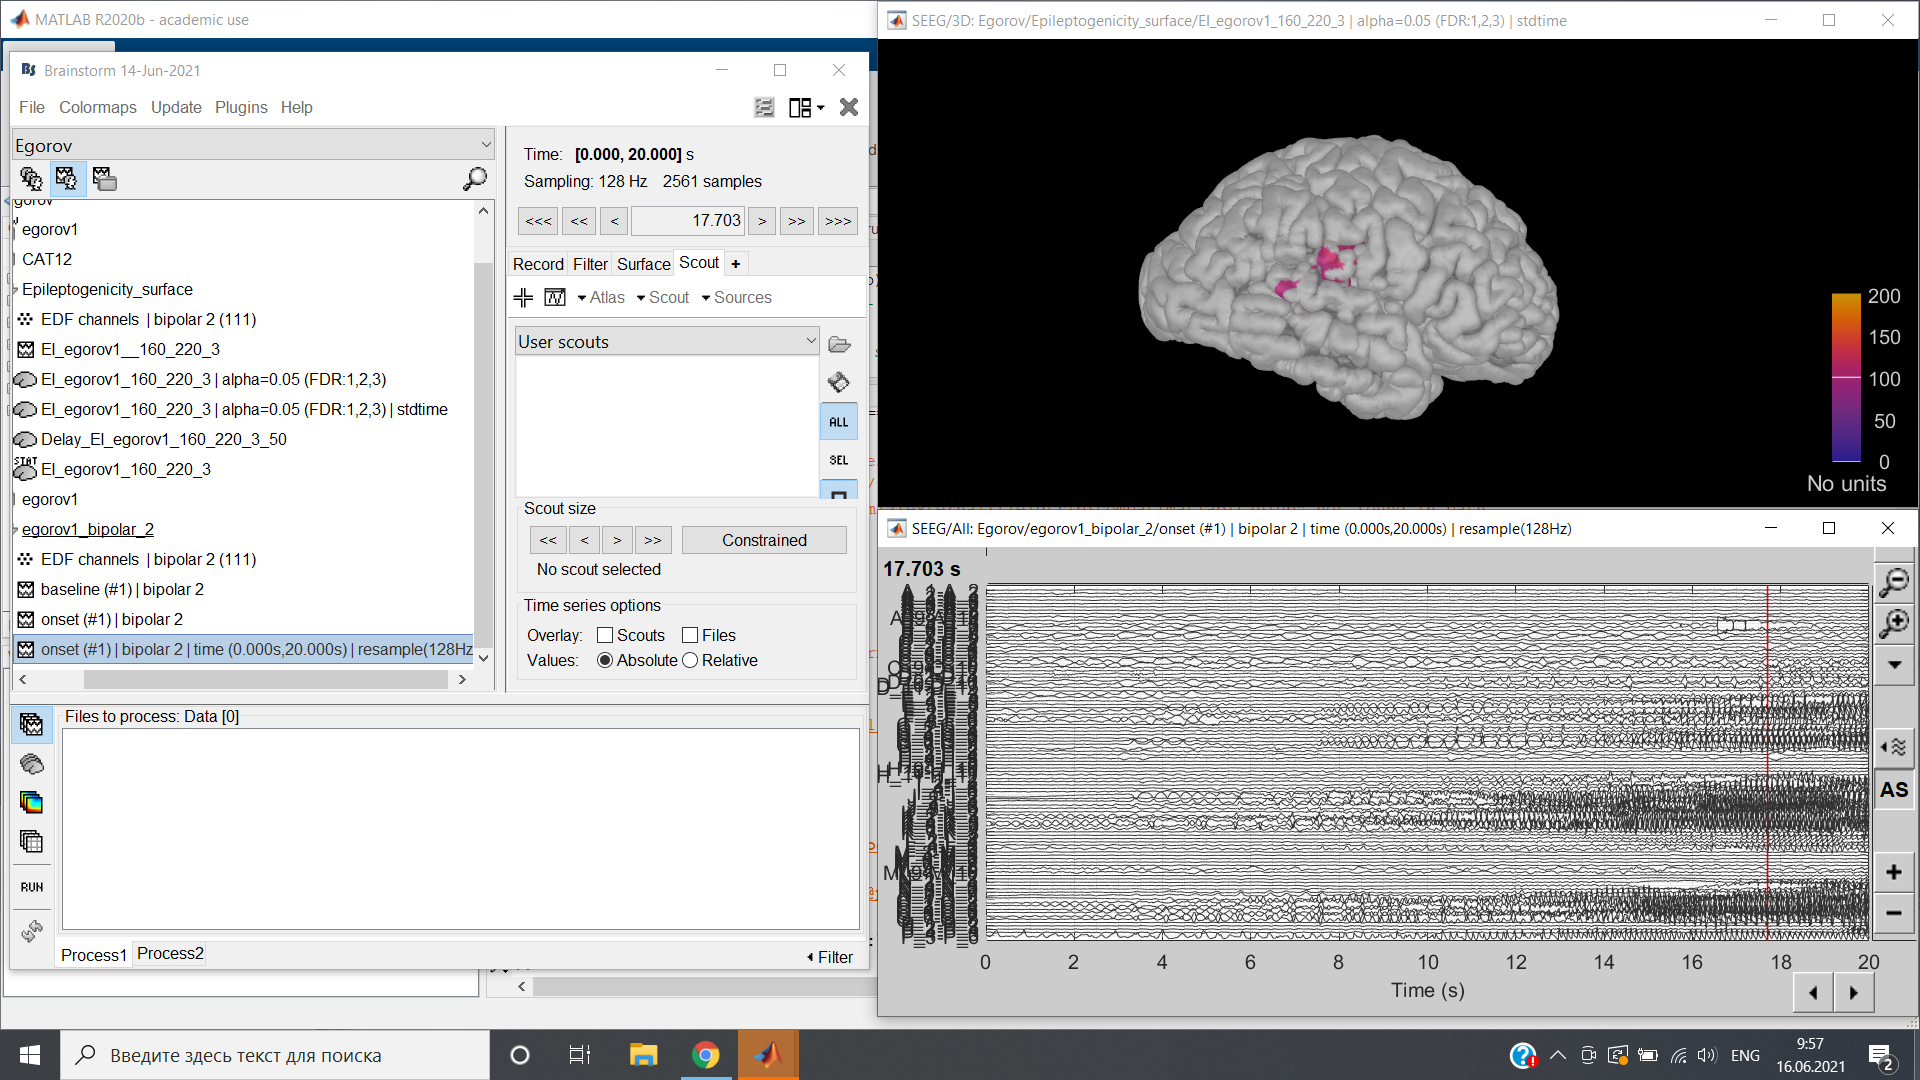
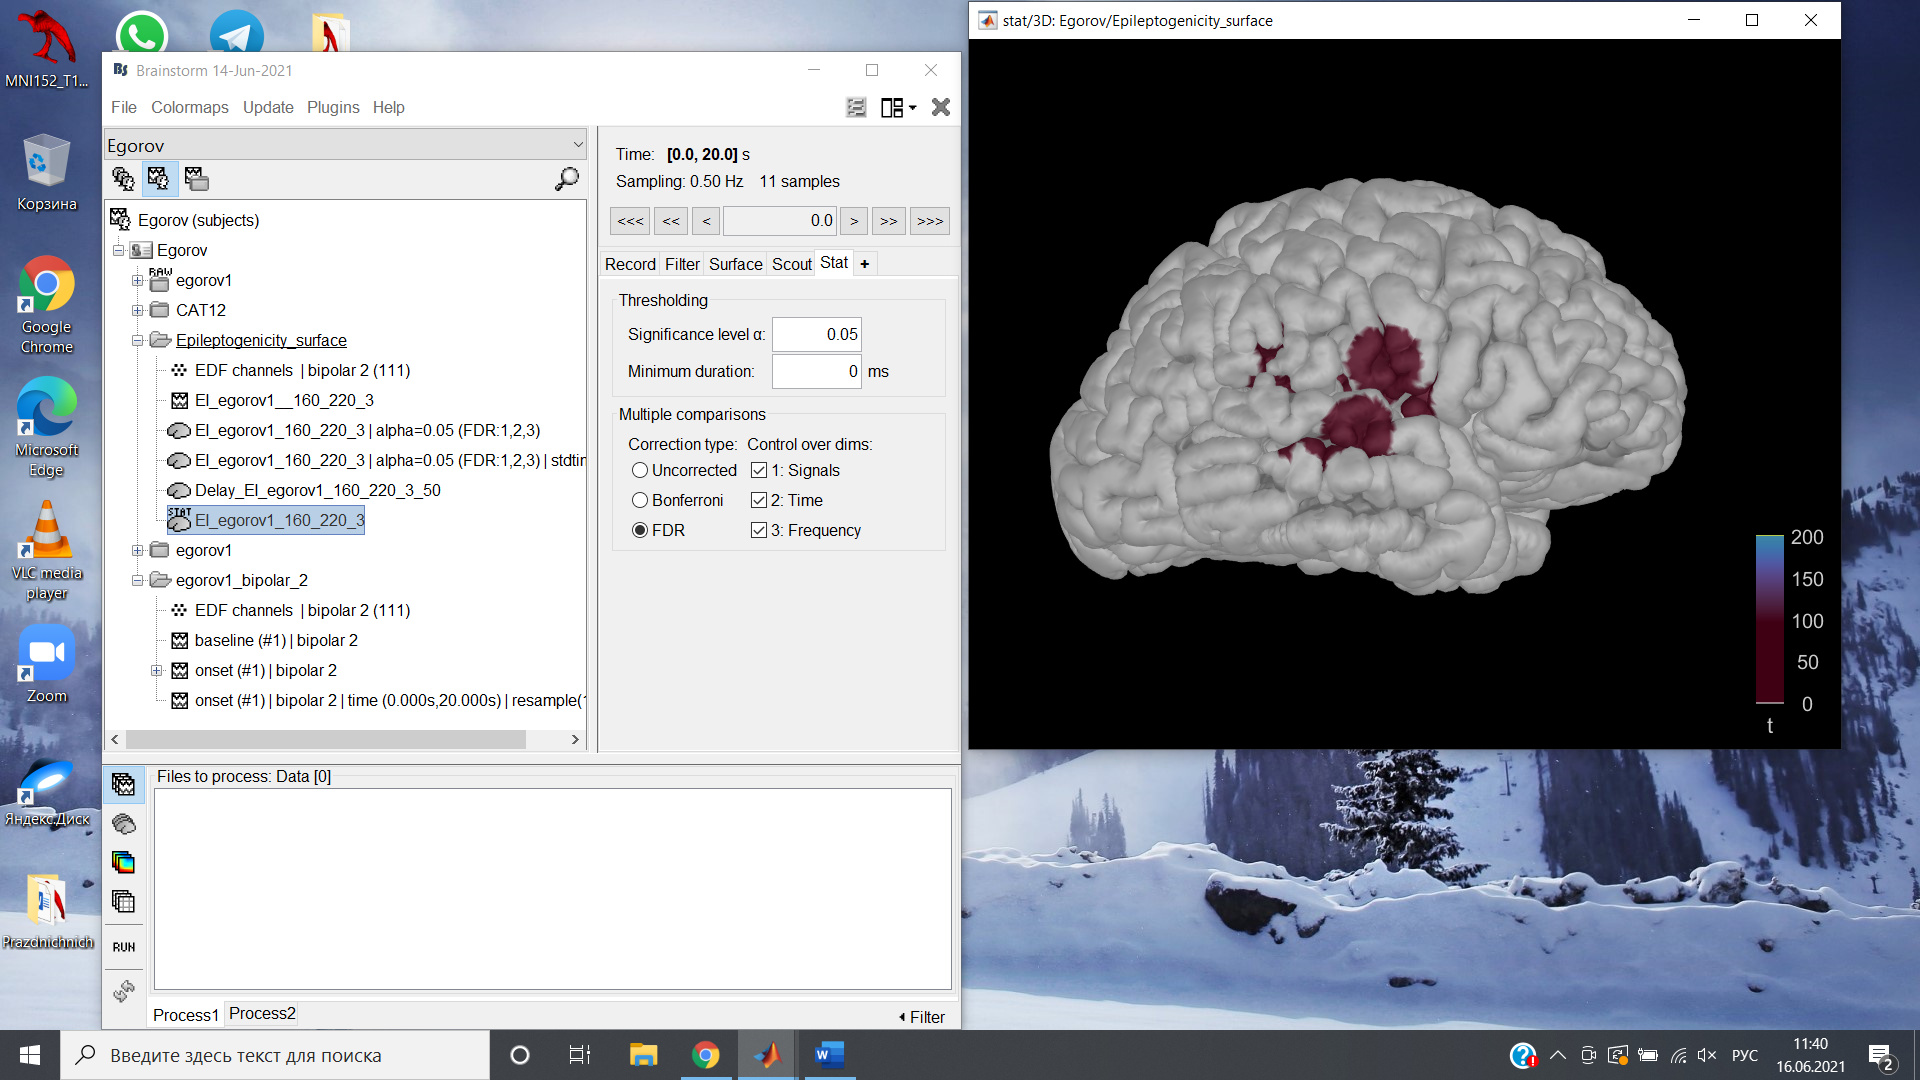
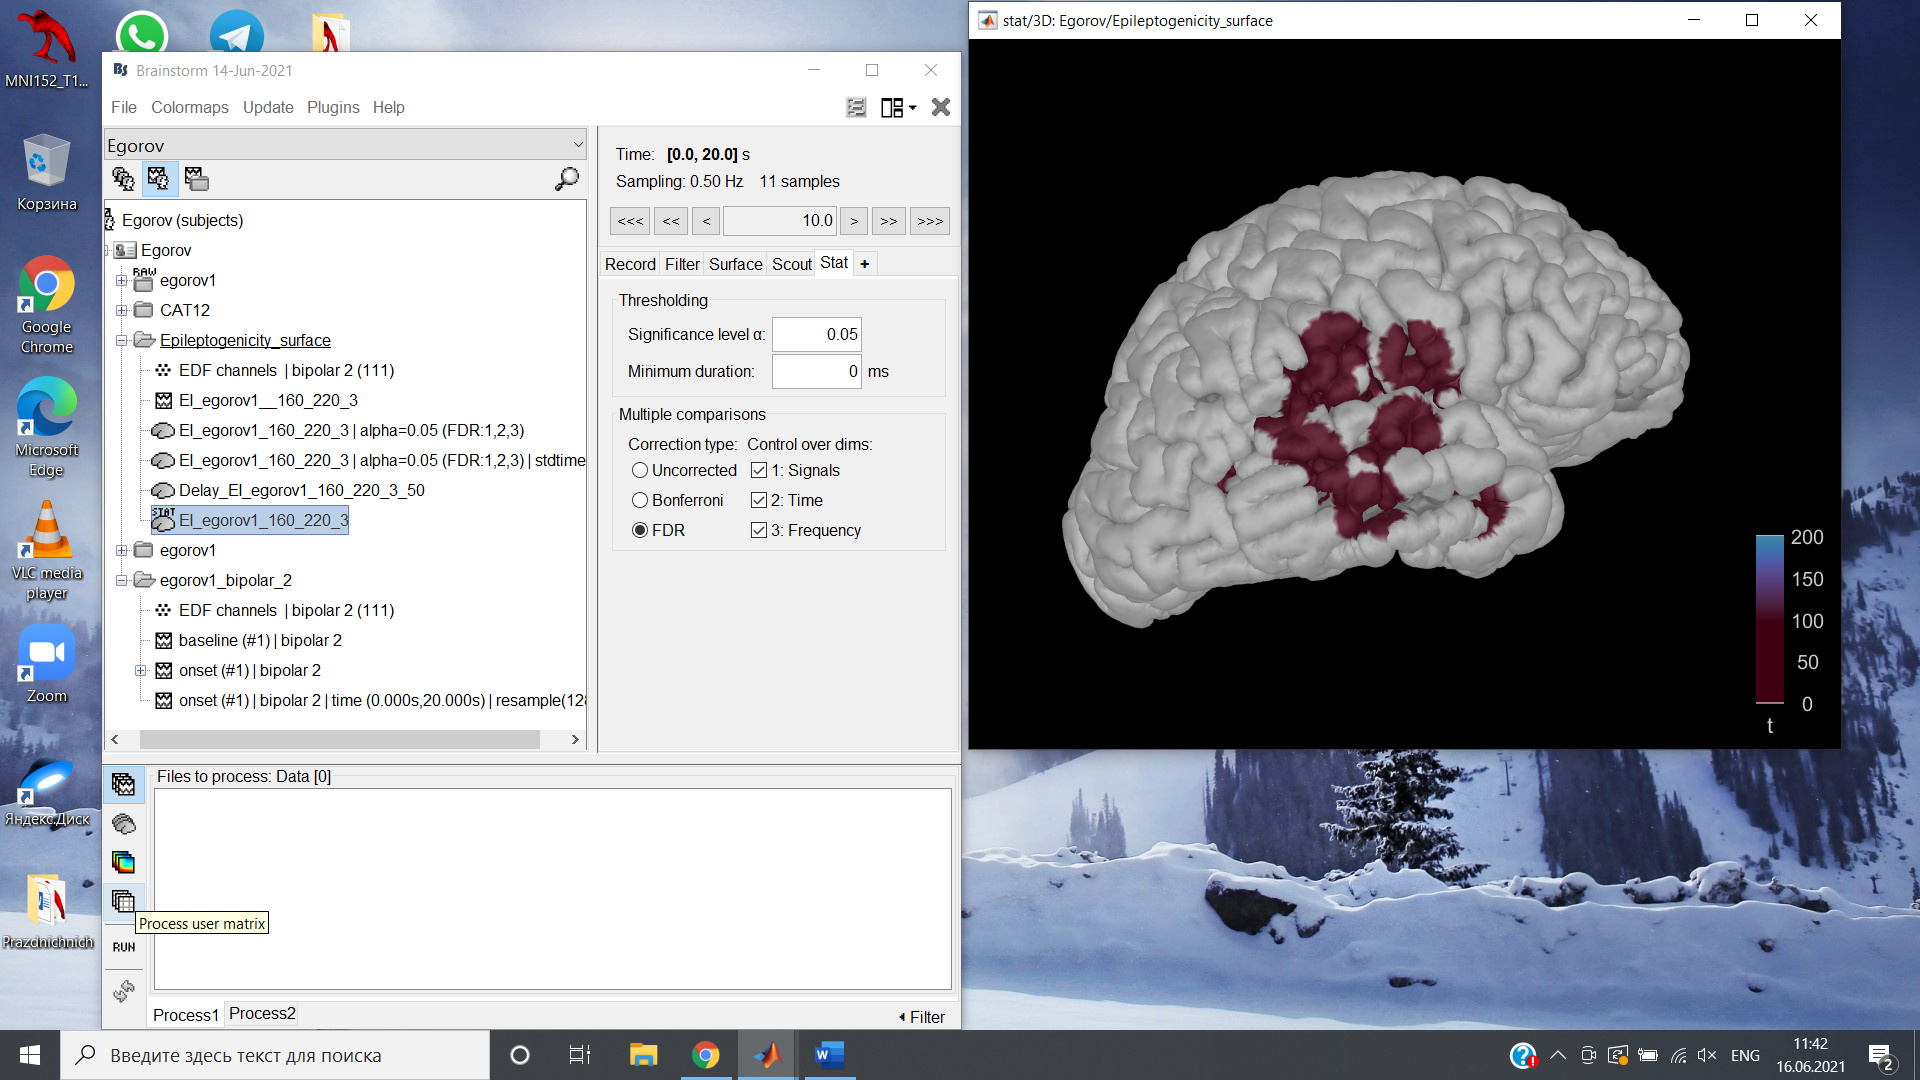
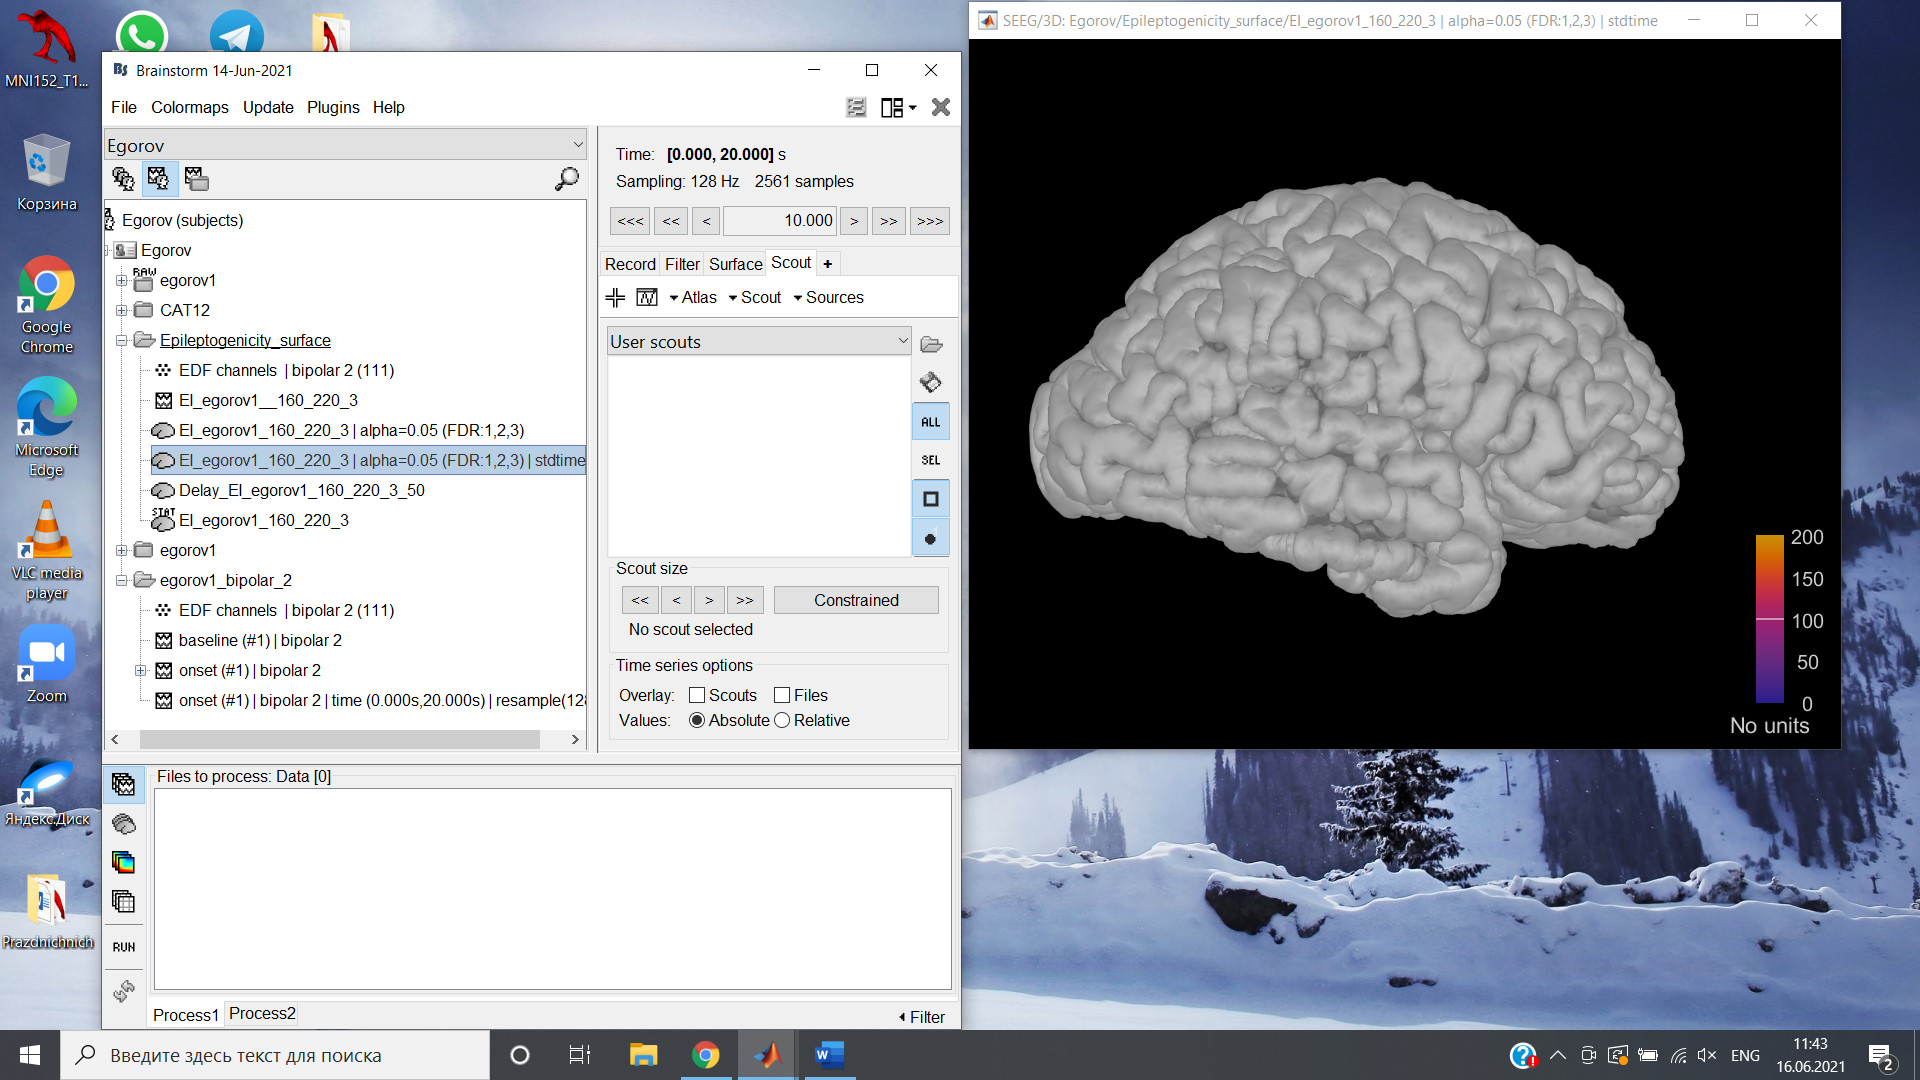
I'm sorry for the bad explanation. The problem is I can see quite a realistic epileptogenicity map in the files before I apply the threshold (an example on the first screenshot). After I apply threshold and open the map, it seems like only one electrode's activity is shown, even when the seizure evolves from partial to general (screenshot 2). I can not find the decision in the tutorial unfortunately
Your two screen captures do no show the same time points.
Adjust the amplitude threshold:
https://neuroimage.usc.edu/brainstorm/Tutorials/SourceEstimation#Display:_Cortex_surface
In the case the of the stat results, the maps are thresholded based on p-values.
When back to "regular source files", you have again the control on the amplitude threshold.
Set it to zero to get the same threshold as what you see for the stat file.
It works now, thank you so much!