Hi Francois,
I recently came across an ERP study that has used brainstorm. The plots seemed interesting to me. When we cluster ERP files, they show in different colours, however is there a method like this image, to change the pattern of the displayed wave (line/dotted line and so on)
Thanks
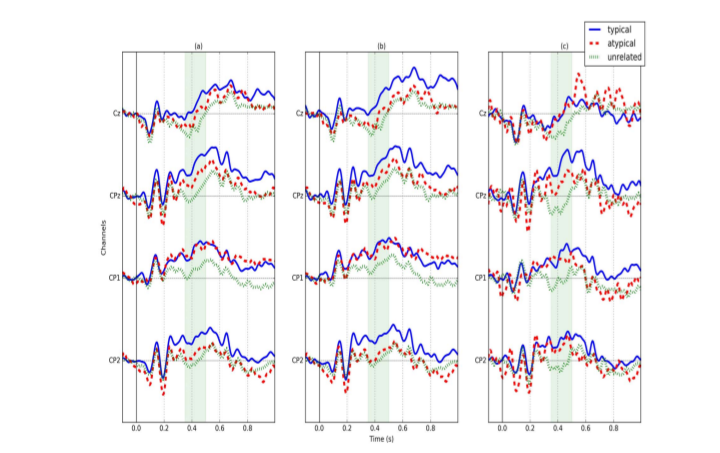
is there a method like this image, to change the pattern of the displayed wave (line/dotted line and so on)
Not from the Brainstorm interface.
But these are all Matlab figures, that you can edit as much as you want with the Matlab tools.
Right-click on the figure > Figure > Matlab controls > Select the "Arrow" button in the toolbar, select objects in the figure (hold shift for multiple selection), right-click > edit the properties you want.
Thanks a lot @Francois. The plots are coming very well. Loved it!
Cheers
1 Like