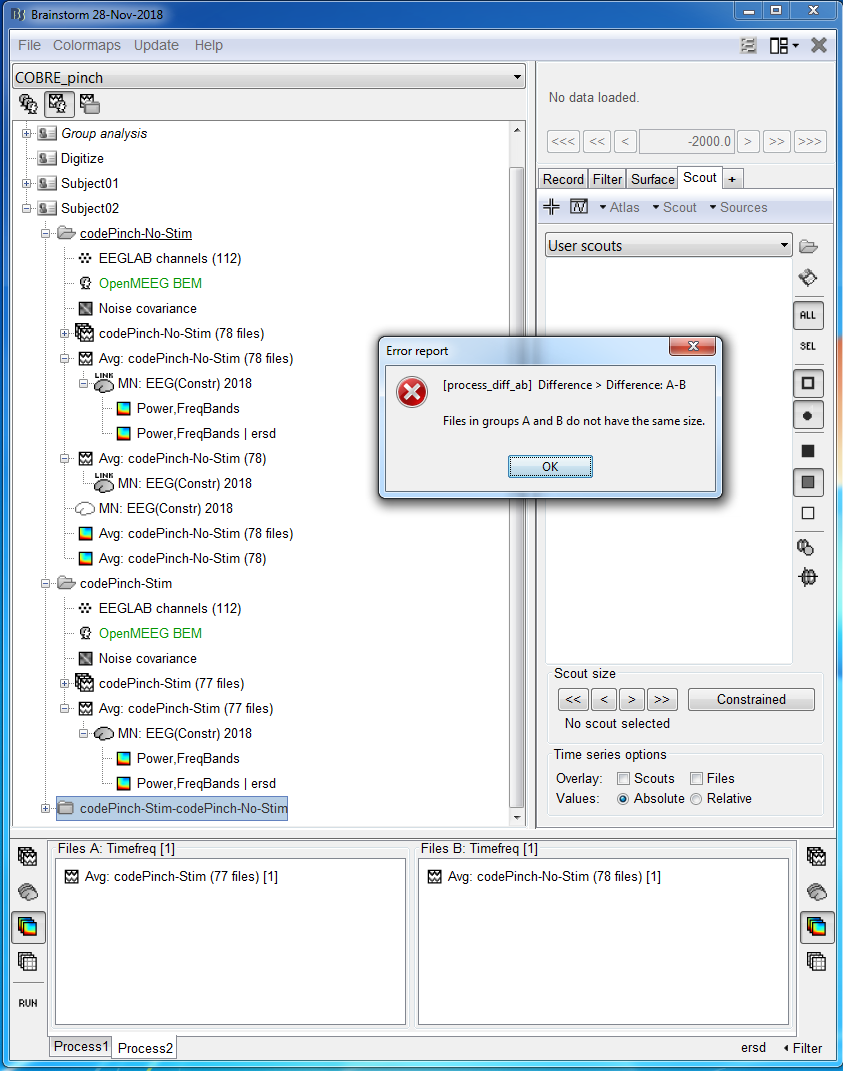
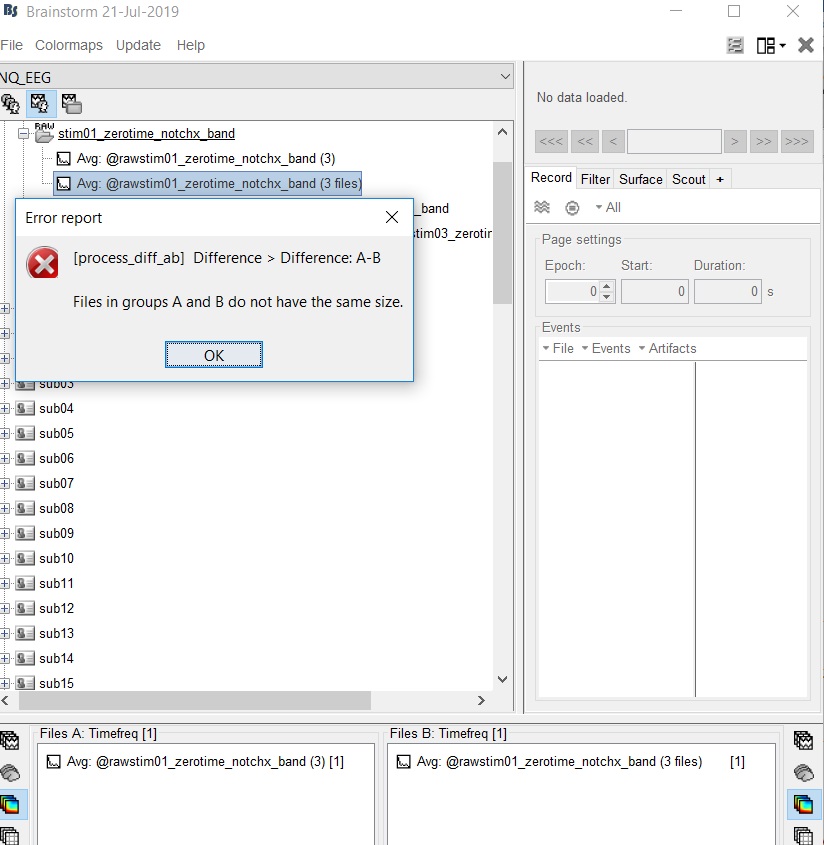
I am trying to compute the difference in brain-based Power, TimeFreq of two averaged EEG files. However, when I run it, this error shows up, saying that "Files in groups A and B do not have the same size." How are they different sizes if they are averages? And how do I resolve this?
Your two files probably have different number of time samples, different lists of signals (channels or sources) or different frequency bins.
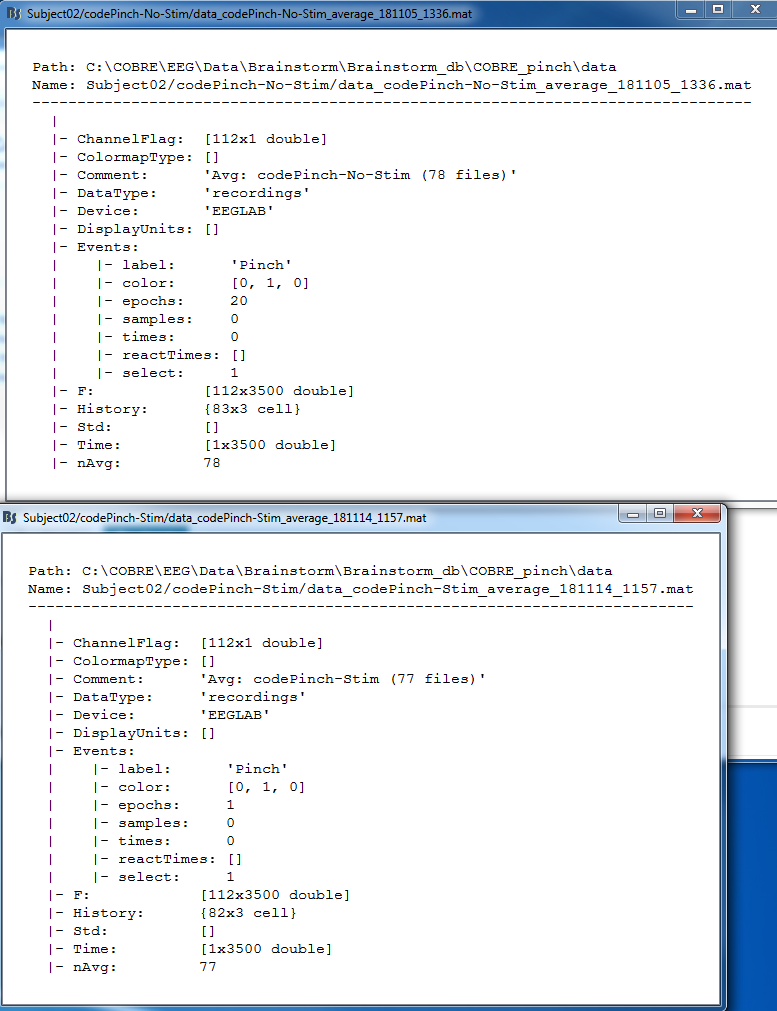
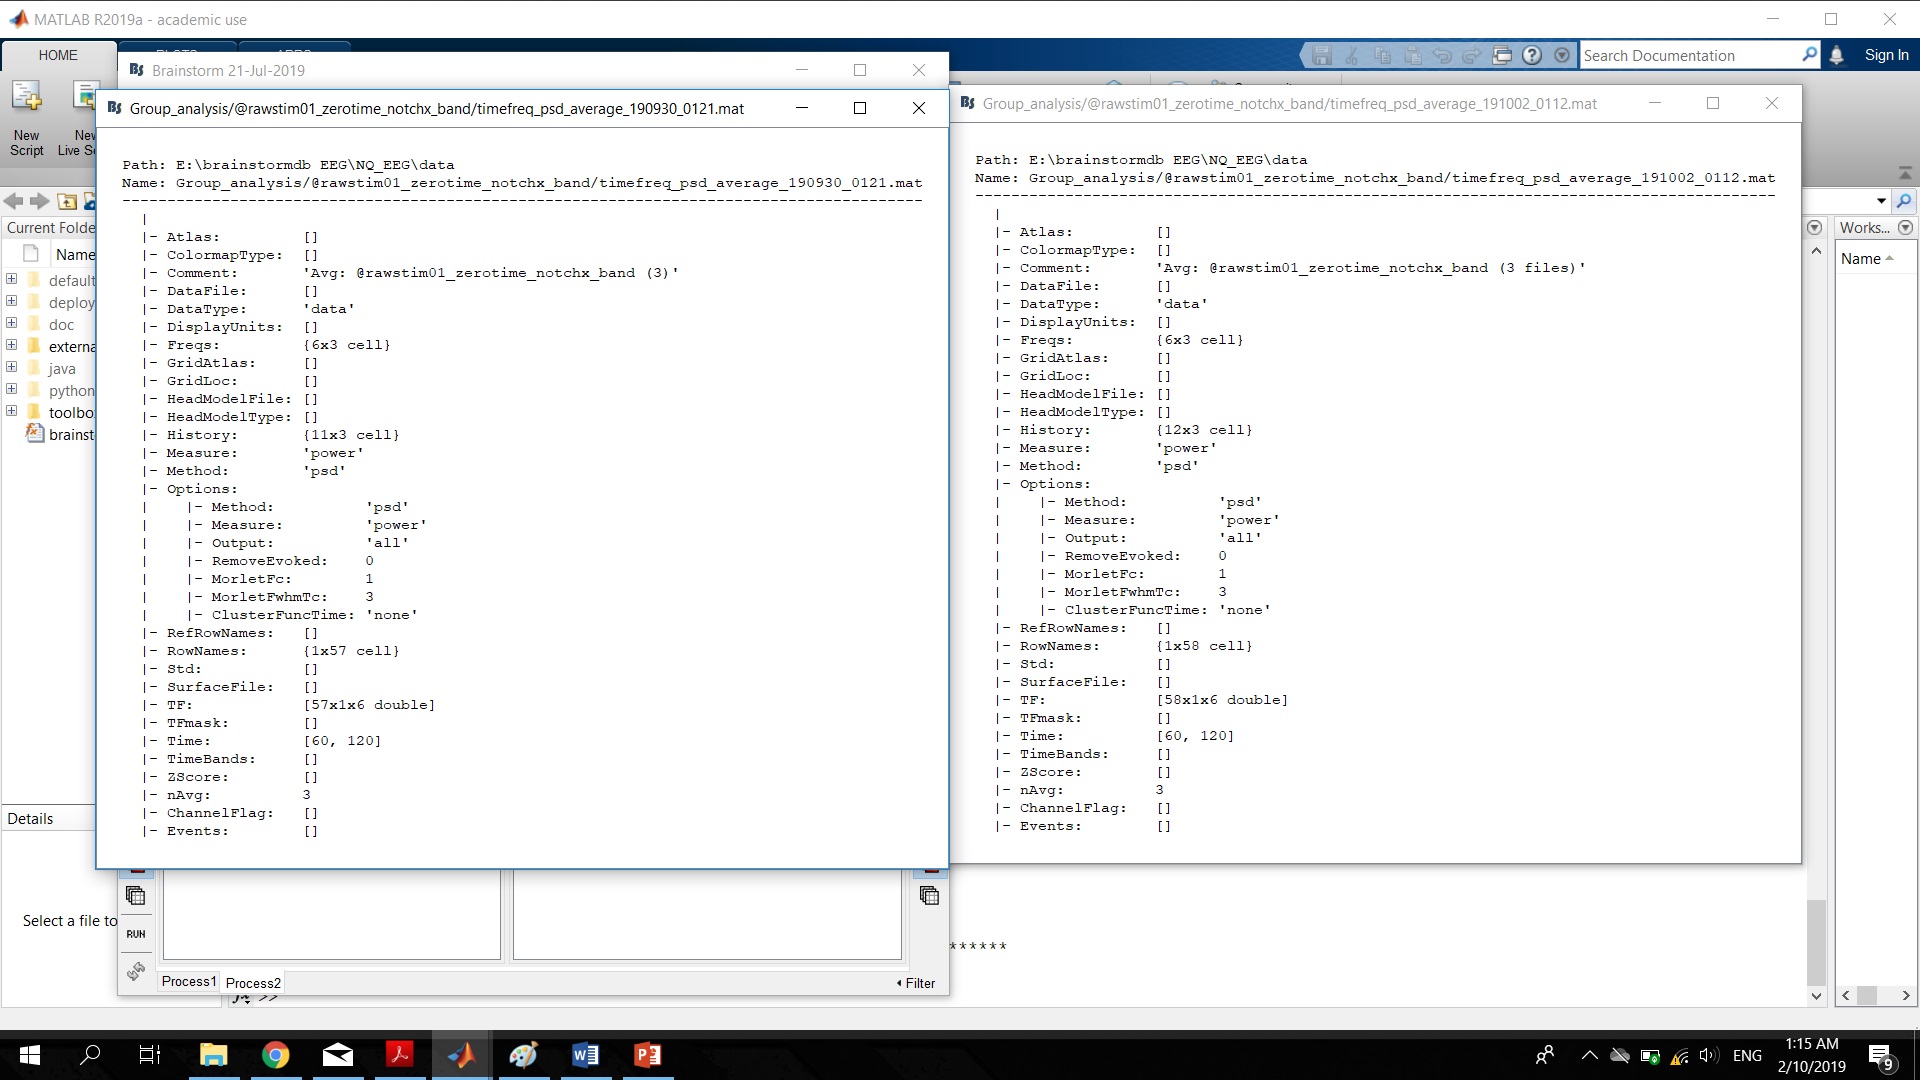
To check the dimensions of the data matrix in a file: right-click on the file > File > View file contents, and check the dimensions of the TF field (or F for recordings, or ImageGridAmp for source results).
I did that for both of the files and this is what came up for both of them. The F field looks the same for both of them. Am I missing something? Or could the problem be something else?
Thank you!
What you are showing is the content of the time series files. In the process box you selected to process time-frequency objects, therefore what you need to compare are the time-frequency objects, which will have a TF field as opposed to an F field. This is where your dimensions are mostly likely not matching.
I am a new user Brainstorm (and signal processing) and would like to seek advice regarding my project. My research question is to identify which condition has a stronger brain response by comparing the power of the brainwaves (theta, alpha, gamma), and to identify where and when the conditions are different.
We have recorded resting state/continuous of simultaneous EEG and MEG.
Recording conditions: passive receptive listening in awake state with eyes closed, 10 experimental conditions, each 3 minutes recording. I have 2 groups of 15 each, a total of 30 subjects.
I have followed the pre-processing steps mentioned in the tutorials, and verified that the data is clean.
Now I am planning to go for the sensor based analysis for the EEG recordings.
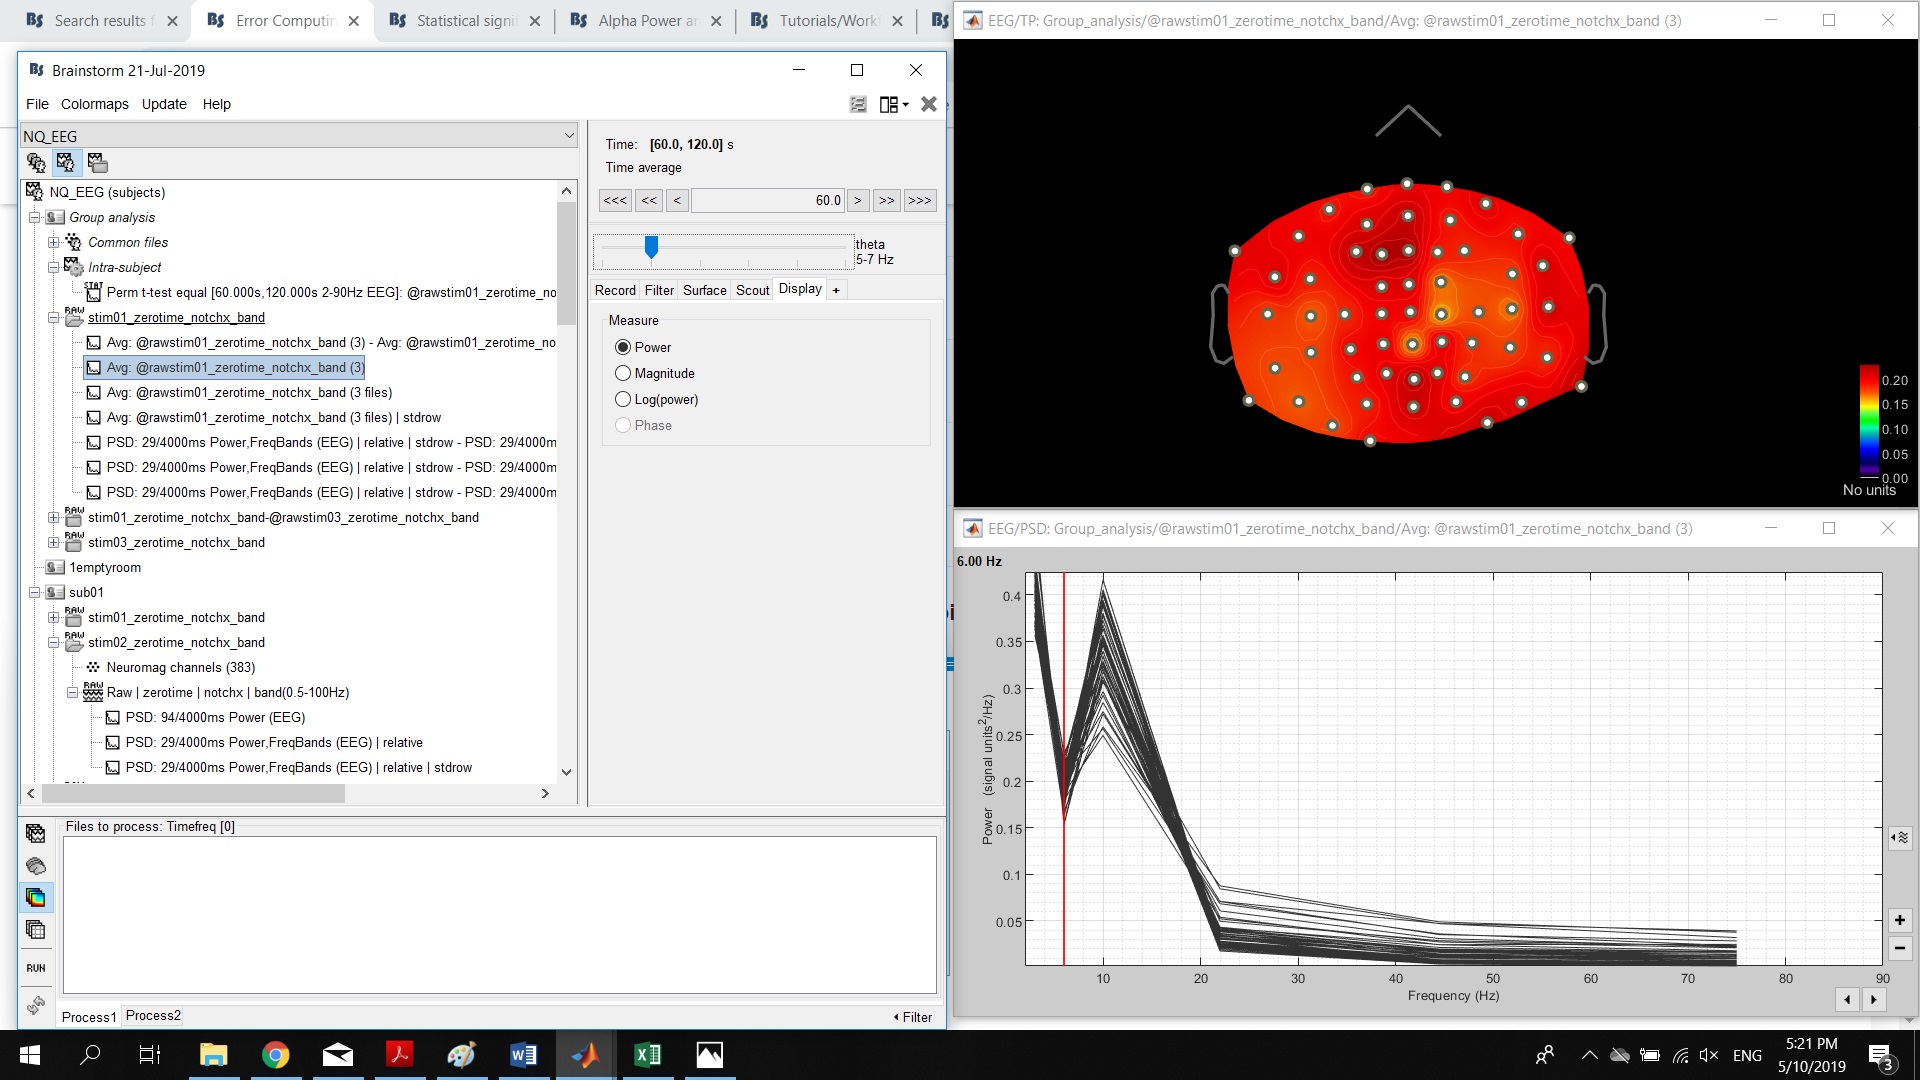
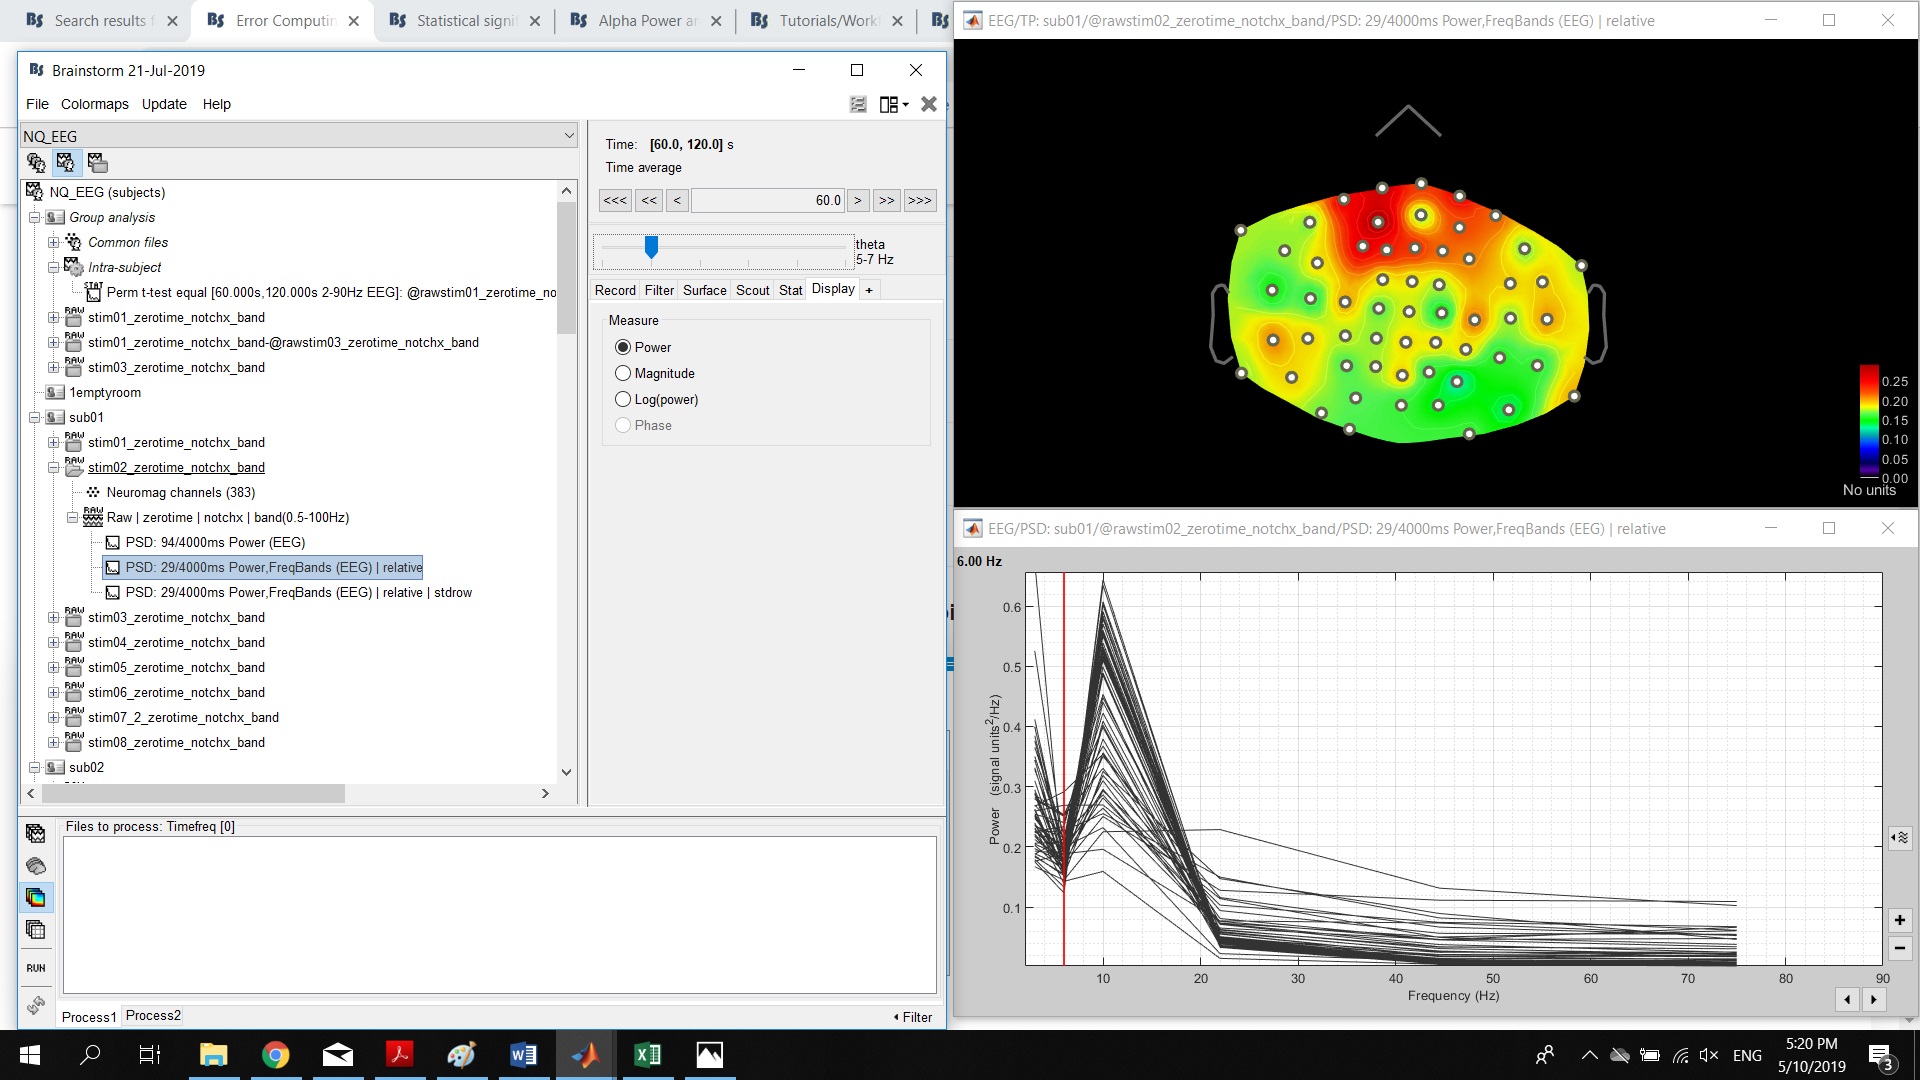
I have computed the PSD in time domain and group in frequency Bands for a time window between 60-120 seconds, followed by spectrum normalization (relative power). Then I computed the average for each condition of same group (average > average files by folder (grand average) + arithmetic average.
Your procedure seems correct.
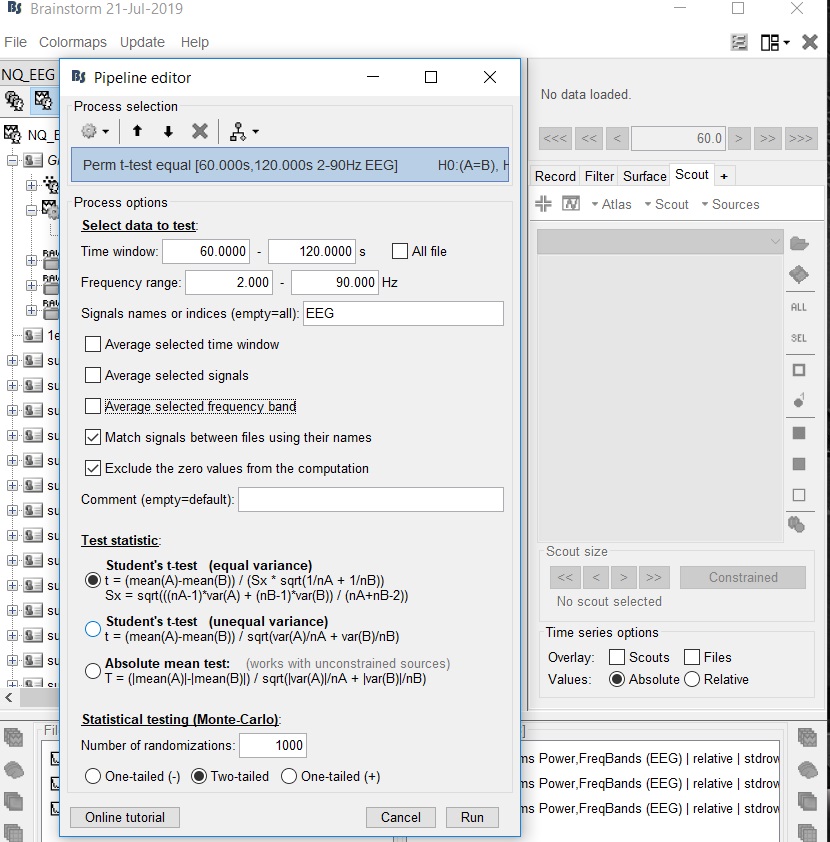
Computing a difference of averages is a good first step for observing main differences. To get an estimation of the significance of the these differences, run a non-parametric t-test between your two conditions across subjects instead: https://neuroimage.usc.edu/brainstorm/Tutorials/Statistics
Regarding your error message:
The two files you present here do not have the same dimensions indeed. One has 57 channels, the other 58. You can use the process "Standardize > Uniform signal names" to fix the files and force them to have the same dimensions, and then do the subtraction.
I have another question , when I compute the PSD/FFT and
I am wondering how can I extract the relative power (get exact values in numbers) of each files as well as the averaged file , If i want to do simple statistical analysis with SPSS .
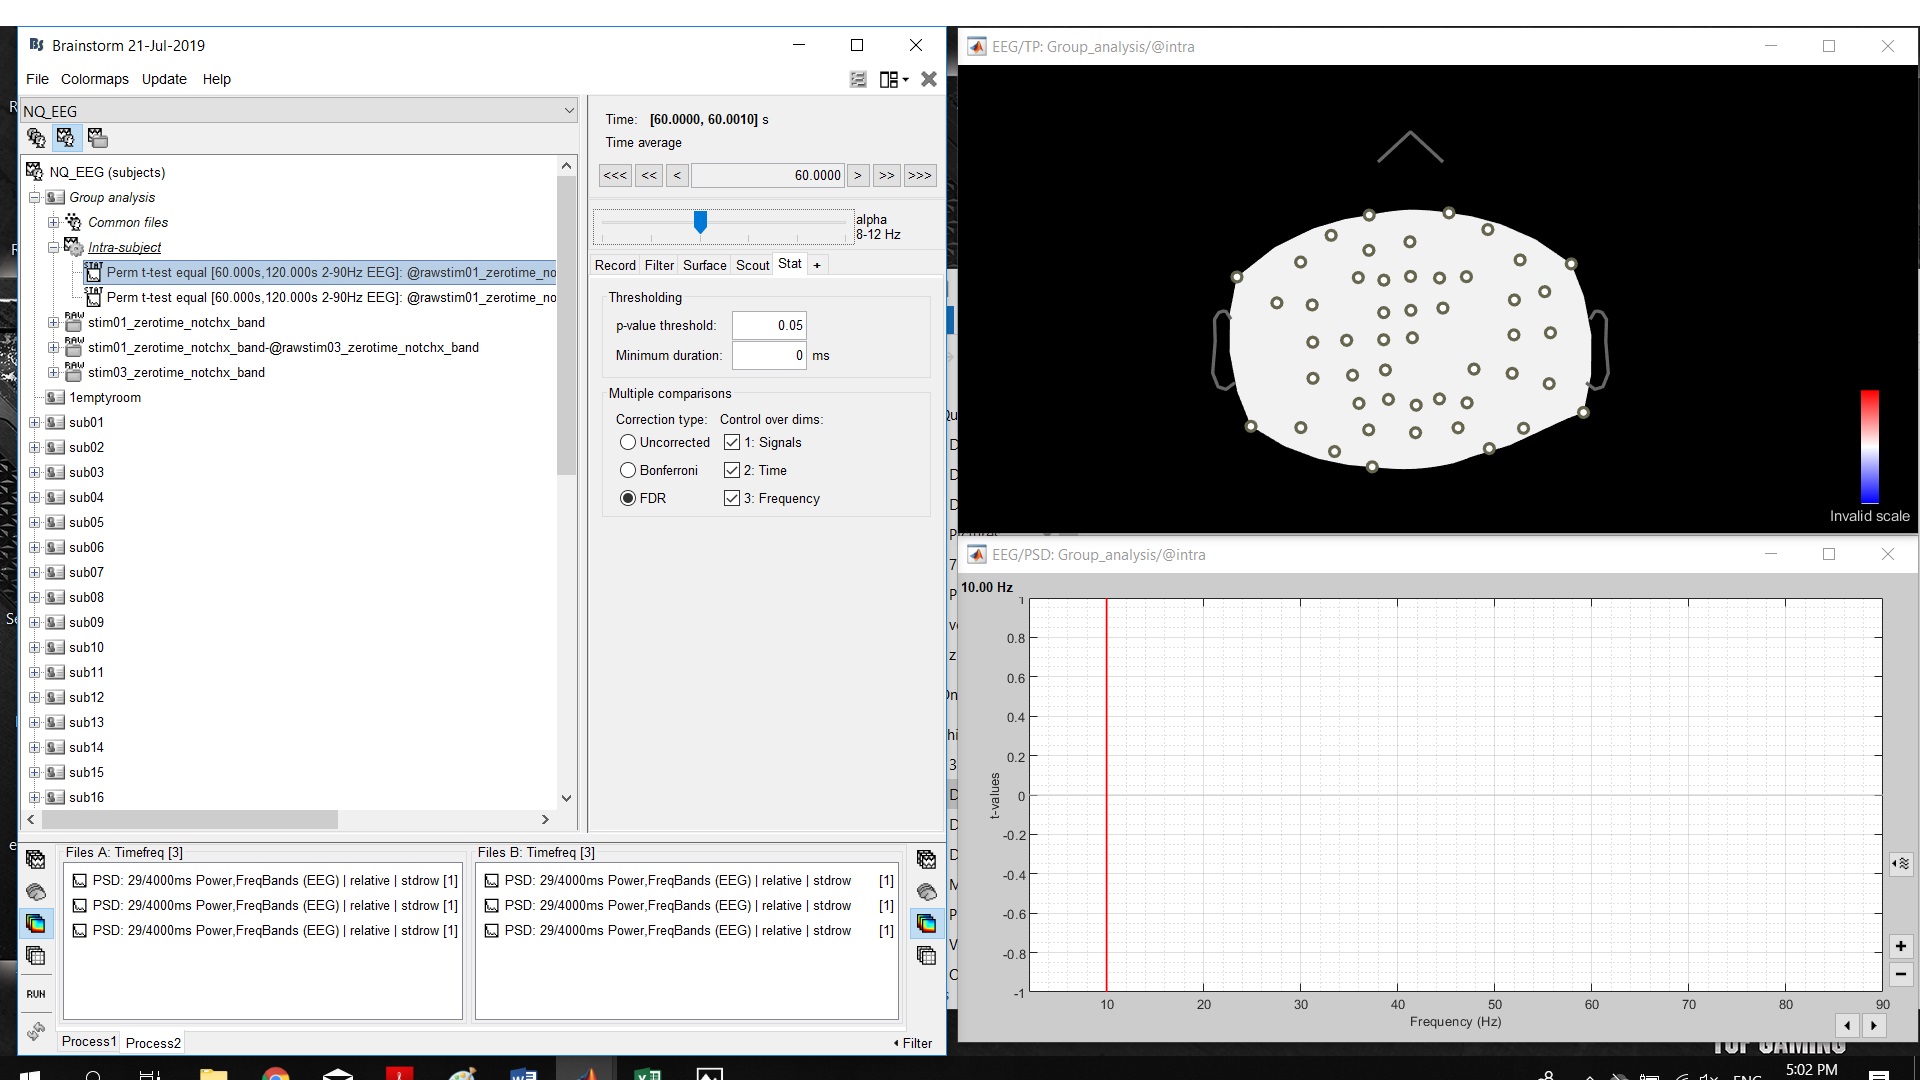
Then maybe there is nothing significant... Increase the p-value threshold and display uncorrected values, you'll see at which level you start to observe something.
I am wondering how can I extract the relative power (get exact values in numbers) of each files as well as the averaged file
All the values are available directly in the Matlab .mat files.
You can also export these values to .csv files, this is maybe easier to load in SPSS: right-click > File > Export to file > change the file format.