Hi Brainstorm team,
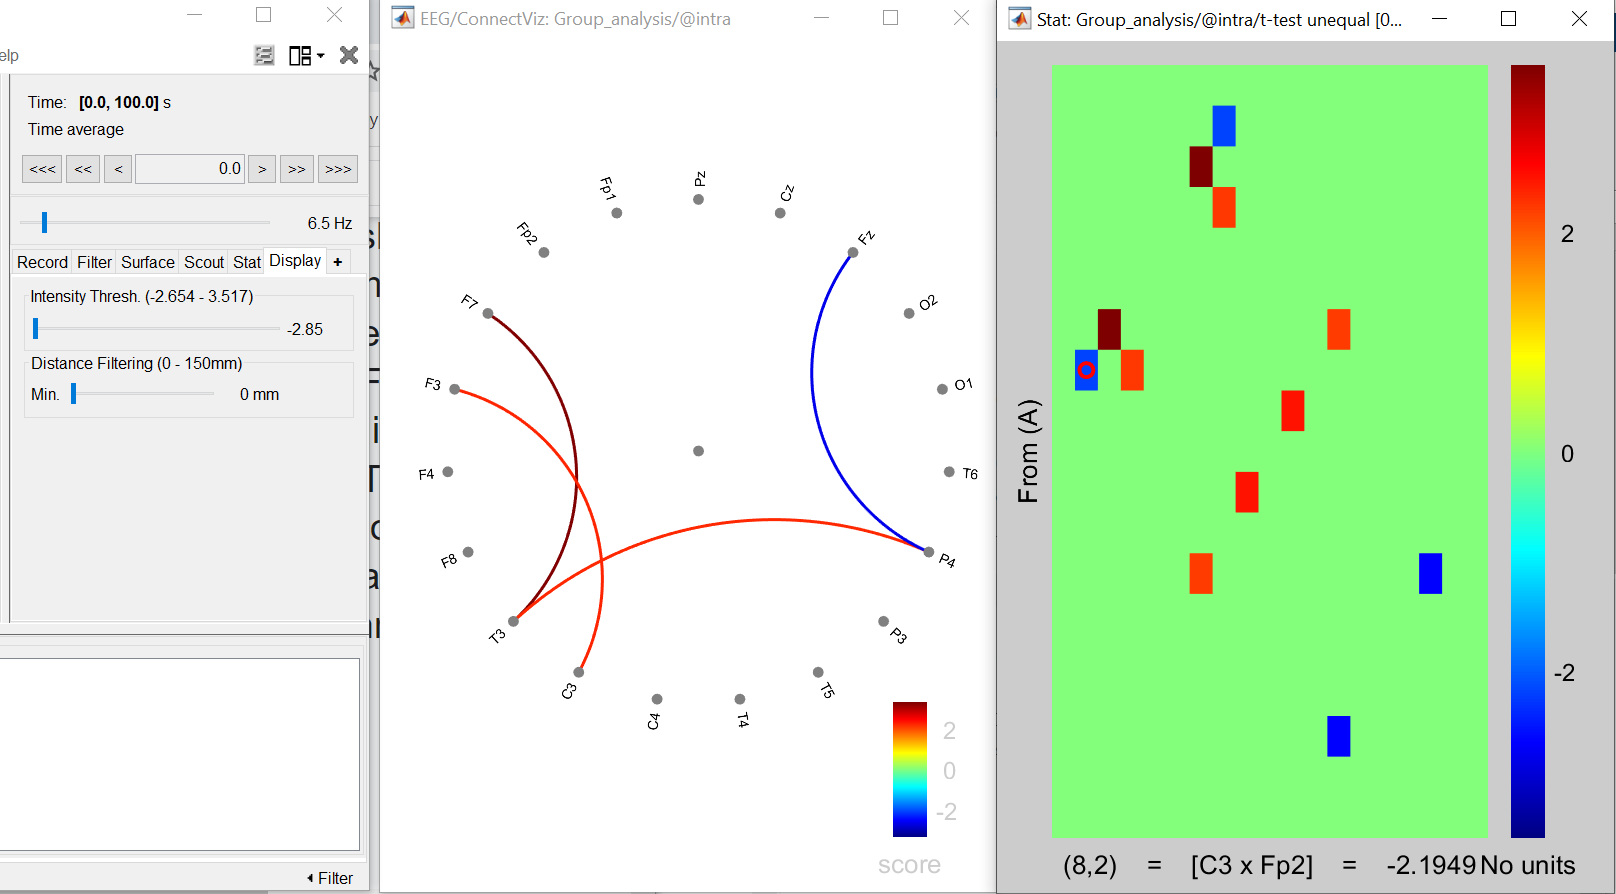
I am trying to display as graph the connectivity on sensors(coherence), but I encountered an error: although I have set the threshold to the minimum value, not all edges are shown. For example, as seen in the image
, the C3xFp2 connection is not shown, although it is above threshold.
Thank you in advance,
Matteo
1 Like
I could not reproduce this case where the threshold slider does not get updated correctly in the Display tab.
Could you please share this file, together with the corresponding channel file?
- To reach a file: right-click on the file > File > Show in file explorer
- Zip the ptimefreq_connectn_...mat and channel.mat file together
- Upload the zip file somewhere
- Post the download link here
Thanks
Thank you for the example data, I could reproduce and understand the behavior of the graph with your data.
There was a fixed maximum distance accepted between two nodes, and the distance C3-Fp2 was above this threshold.
I don't know why this test was here, I simply removed it: Bugfix: Graph viz: Removed arbitrary max distance threshold · brainstorm-tools/brainstorm3@7a0f99c · GitHub
The connection is now displayed:
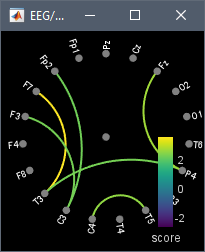
Update Brainstorm to get this fix.
@Sylvain @Raymundo.Cassani @hossein27en
Any idea why this test was here?
Is there any chance I broke something?