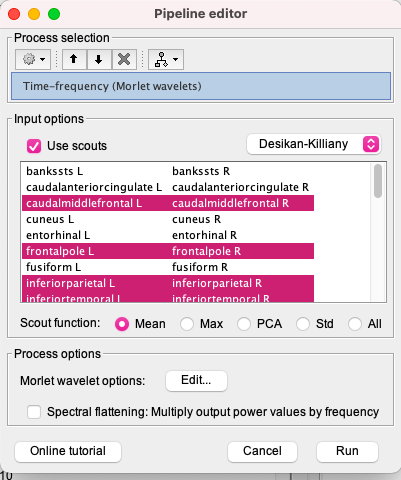
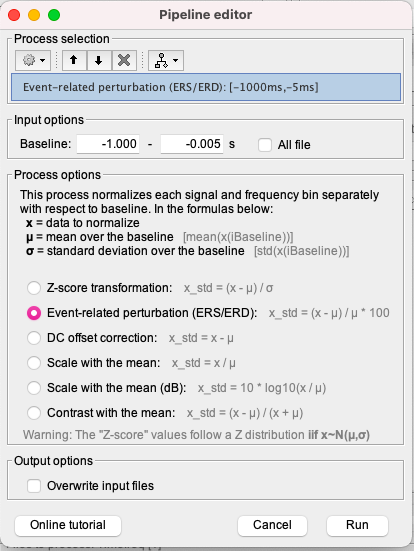
Hi, I'm studying and EEG signal in brainstorm, I've projected sources with Desikan Killiany and now I want to see the synchronizations and desynchronizations, what I do is to do the time frequency decomposition of the projected sources with Morlet wavelets, I choose the areas I want, the central frequency and the time resolution but no negatives values appear, then I do the baseline normalization and I just have synchronizations when it's proved that in alpha and beta frequency bands there are desynchronizations of the brain, I also change the options and I dont have absolute values or unconstraint values so I dont know what to do next in order to see the desyncronizations.
Thanks
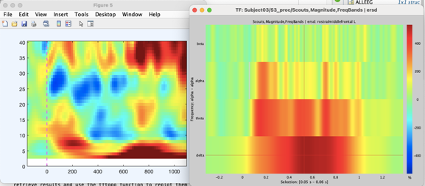
On the right is the eeglab ersd which have (in blue) the desynchronizations, compared to the left one which is brainstorm and it's just seen the synchronizations which are the same (same time and same frequency band)
And your question is, I guess, how to obtain the same image in Brainstorm than in EEGLAB?
Unfortunately, we won't be able to help you with that little information. There are so many things that happened between the raw data and this figure. This requires a complete revision of your processing pipeline and your data quality, which is not something that we will be able to do through this forum.
Try to identify the one specific step in which you think you think there is something you don't understand. Then post screen captures showing the files of interest in the database explorer, how the files look like when you display them with Brainstorm, the process options, etc. Explain for that one specific step why the results you obtain do not look like what you expect.
More generally, if you are satisfied with the results you obtain with EEGLAB, why do you bother redoing the same thing in Brainstorm?
The two displays are not entirely equivalent though: BST's is clustered in frequency bands and EEGLab's shows a continuum of frequencies. EEGLab's baseline seems to be twice as shorter too, which will influence the scaling of the ERDS.
It's not that important if I dont have the frequency bands divided as long as I see what happens at each one. The baseline is shorter in eeglab because of the time division in the graphs but I chose the same one
Well, I would argue that if you need to compare two approaches supposed to provide similar outputs, you need to use them with the exact same parameters.
I see in your screenshot above that the baseline used for the ERDS computation is [-1, 0] s: please make sure this is what you meant to use and that this was the same baseline definition for EEGLab.
The pipeline looks OK I think.
It would help for diagnostics that you post what the data looks like at each step.
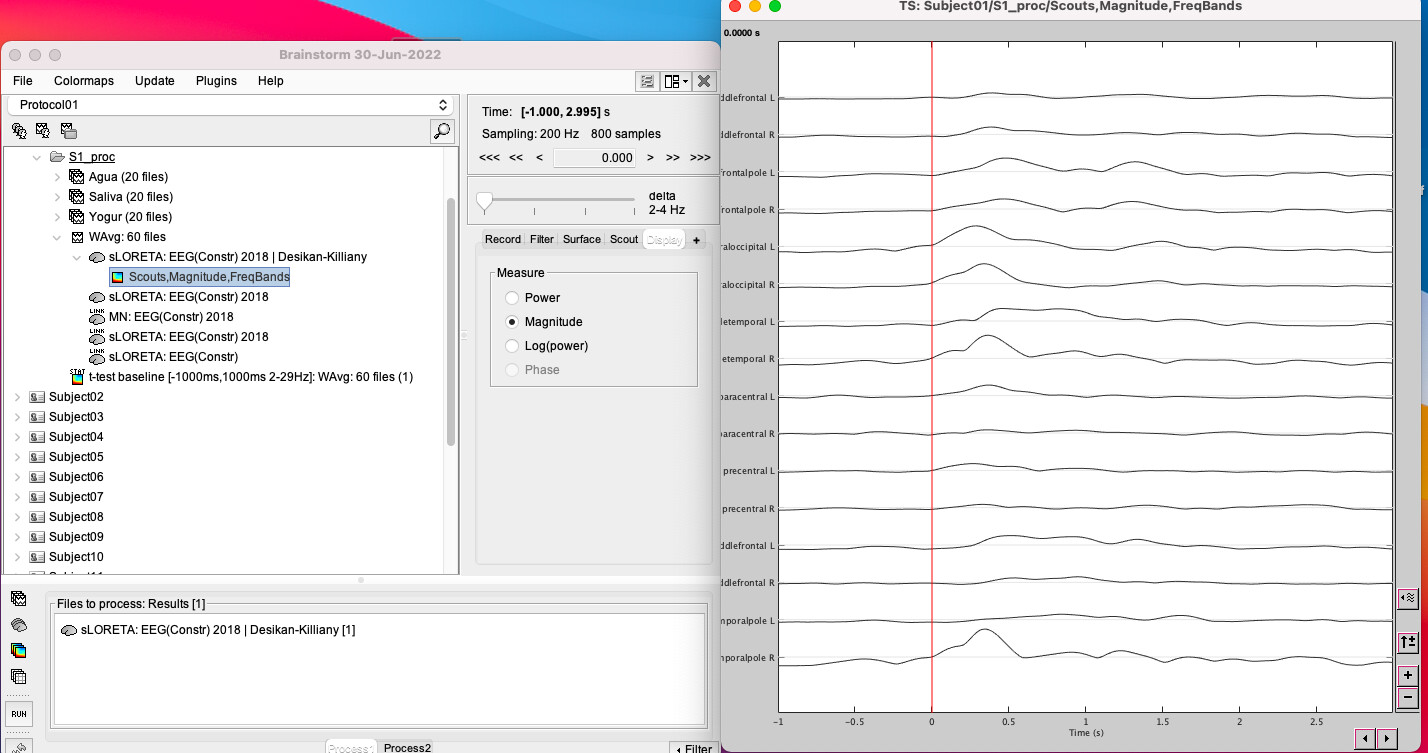
Including the time series for the scout that you use to illustrate the final results.
First of all thanks for helping, it means a lot!
-
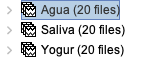
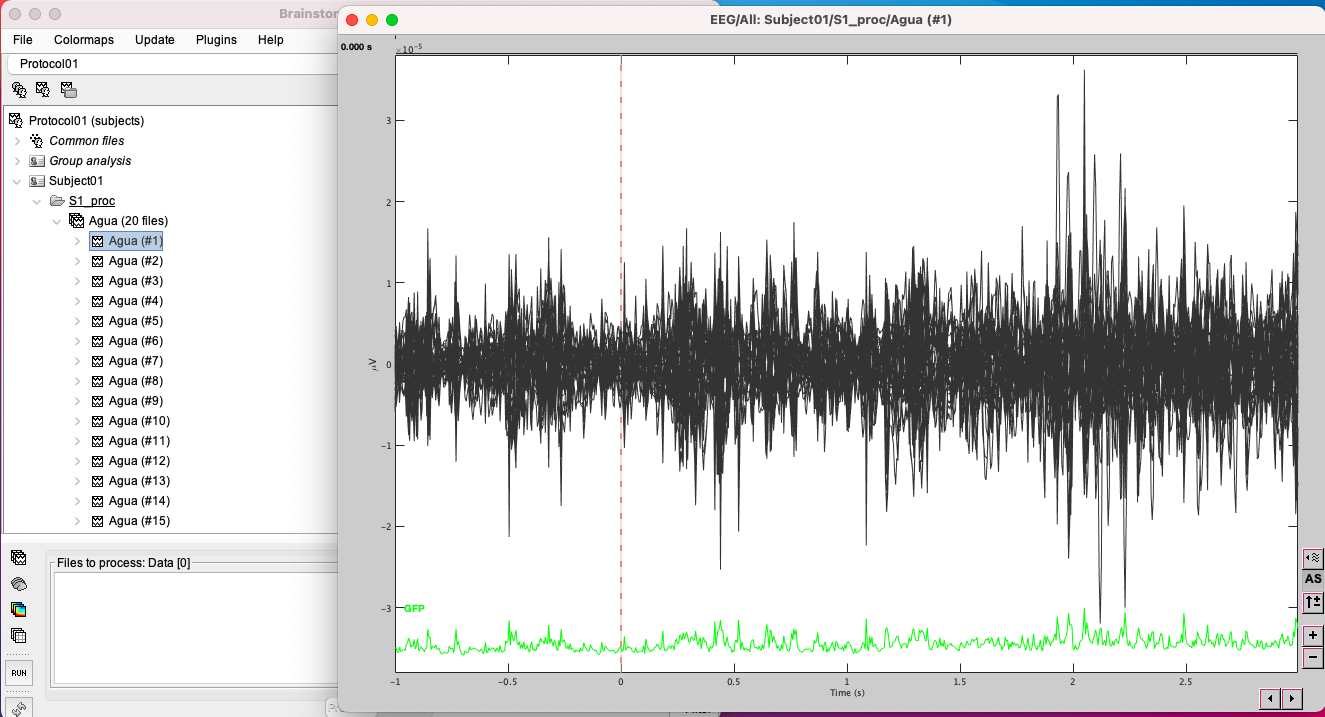
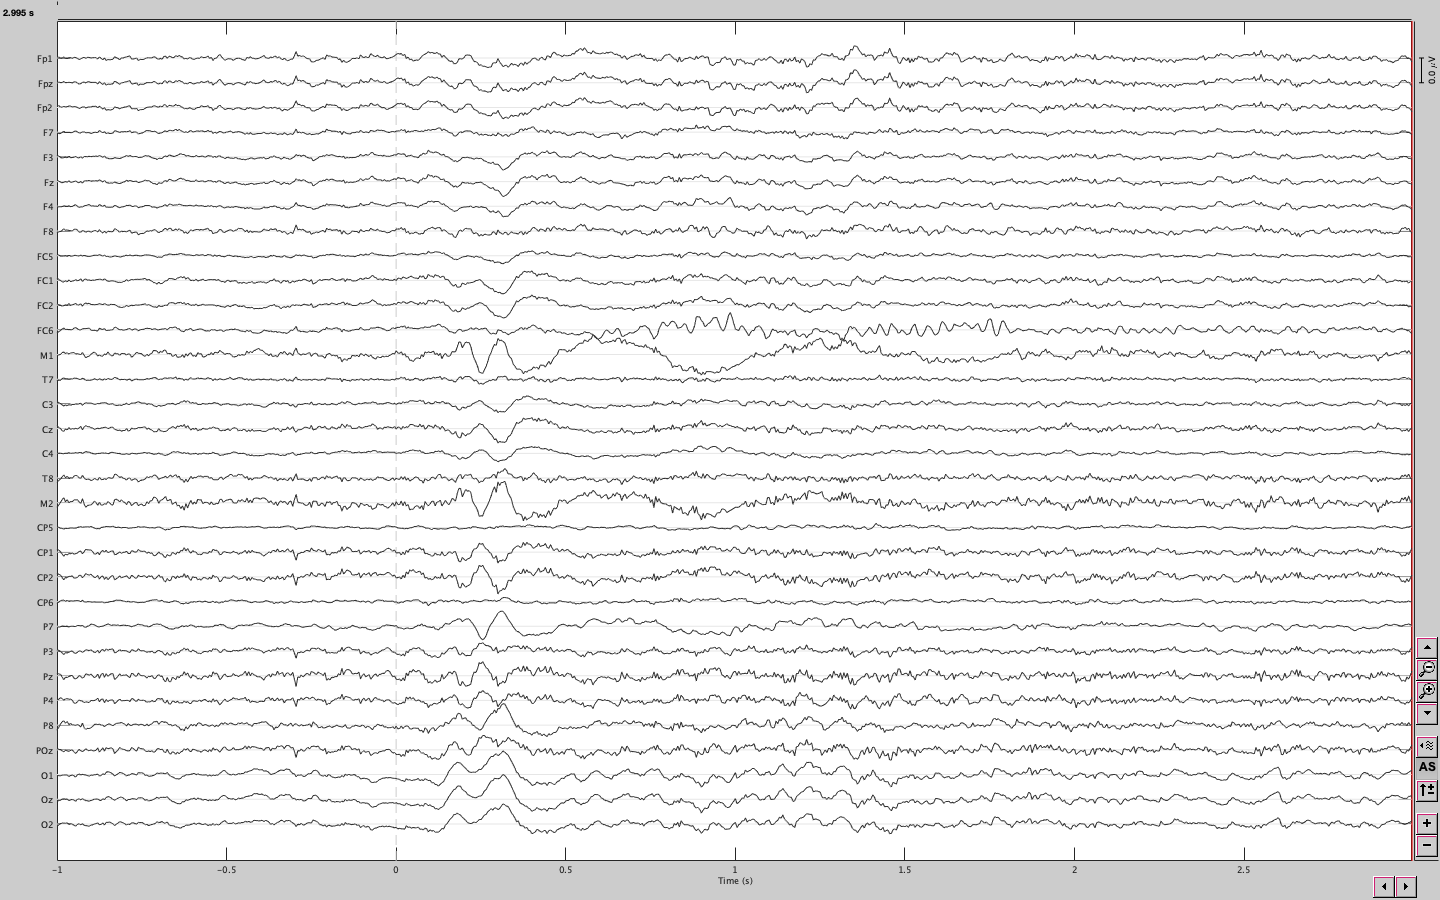
This is the raw data from one event (water and first sip), I have 20 files of each event.
-
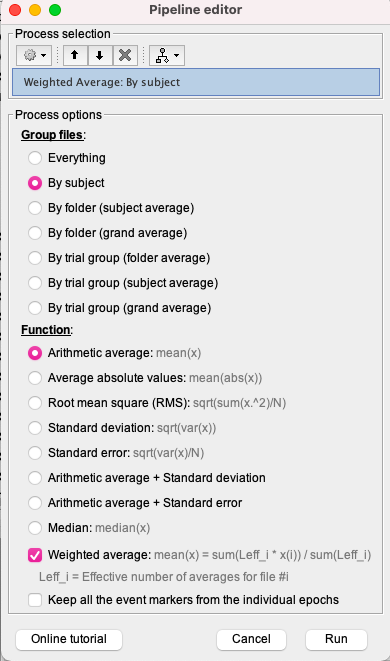
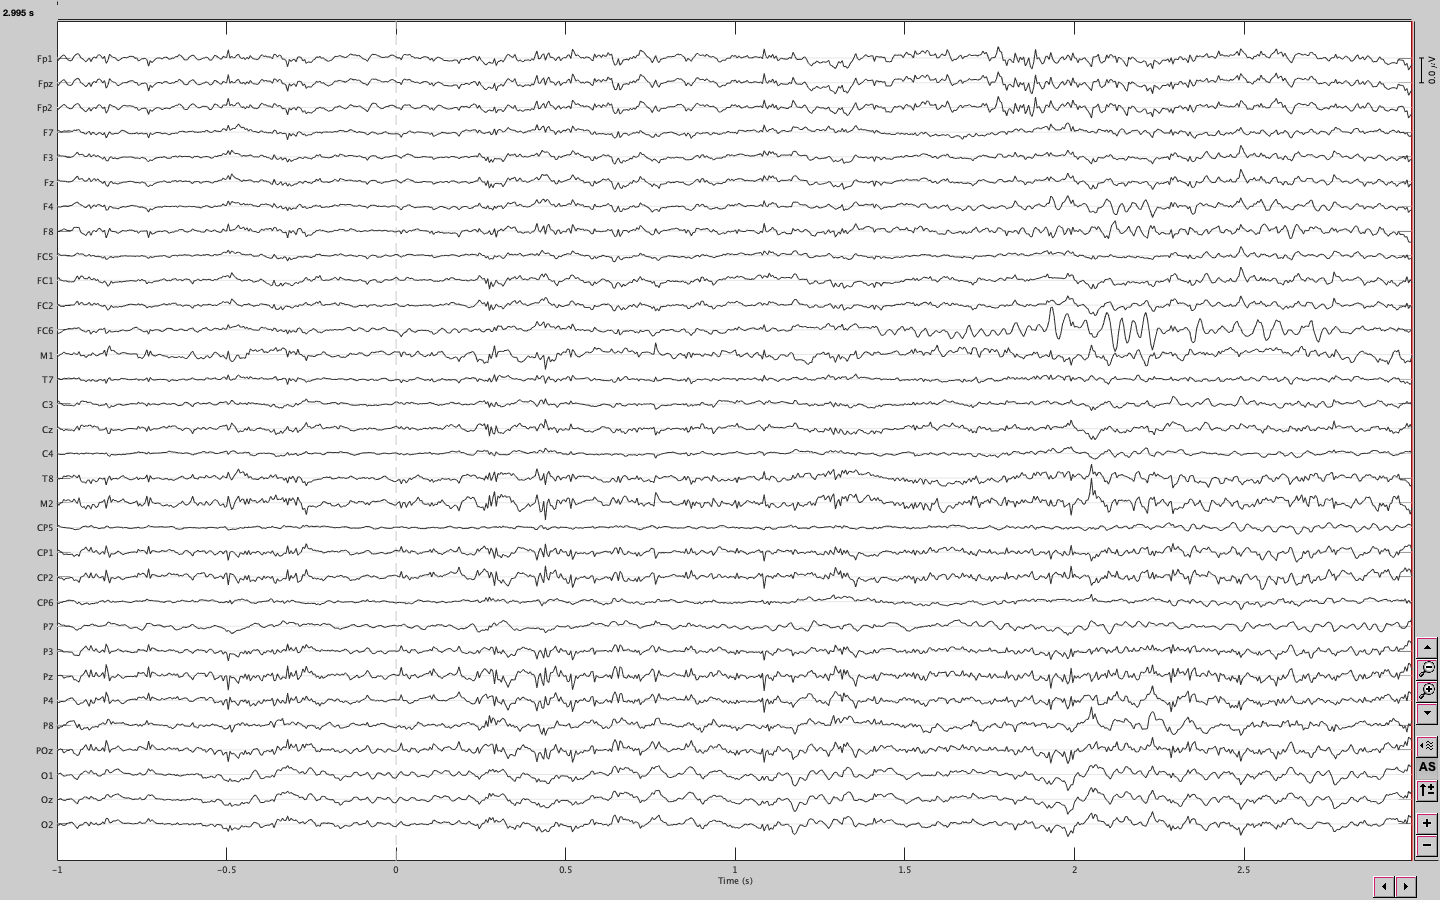
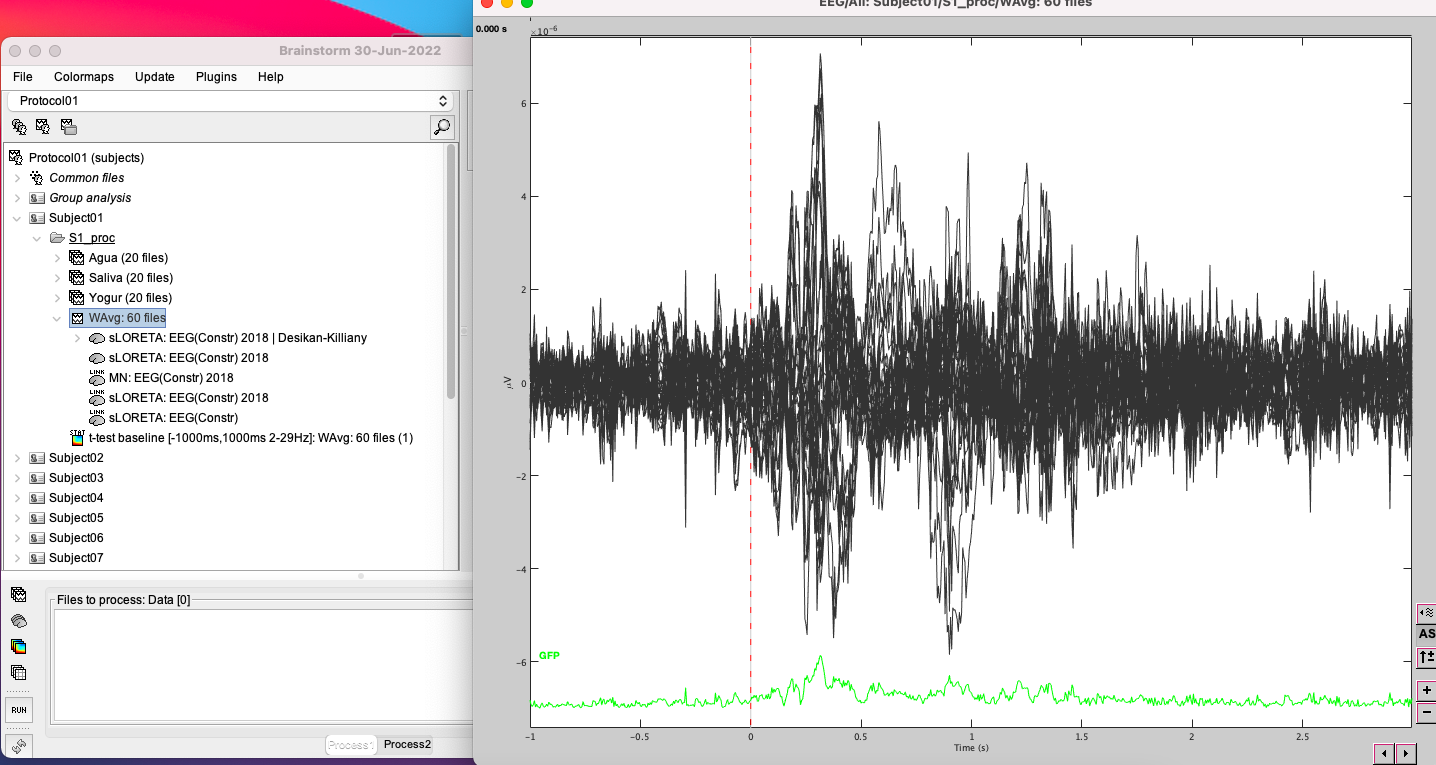
I do average as I explained to obtain this signal
-
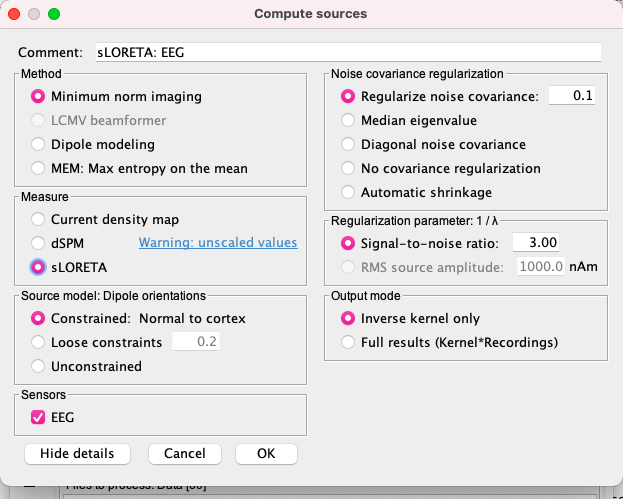
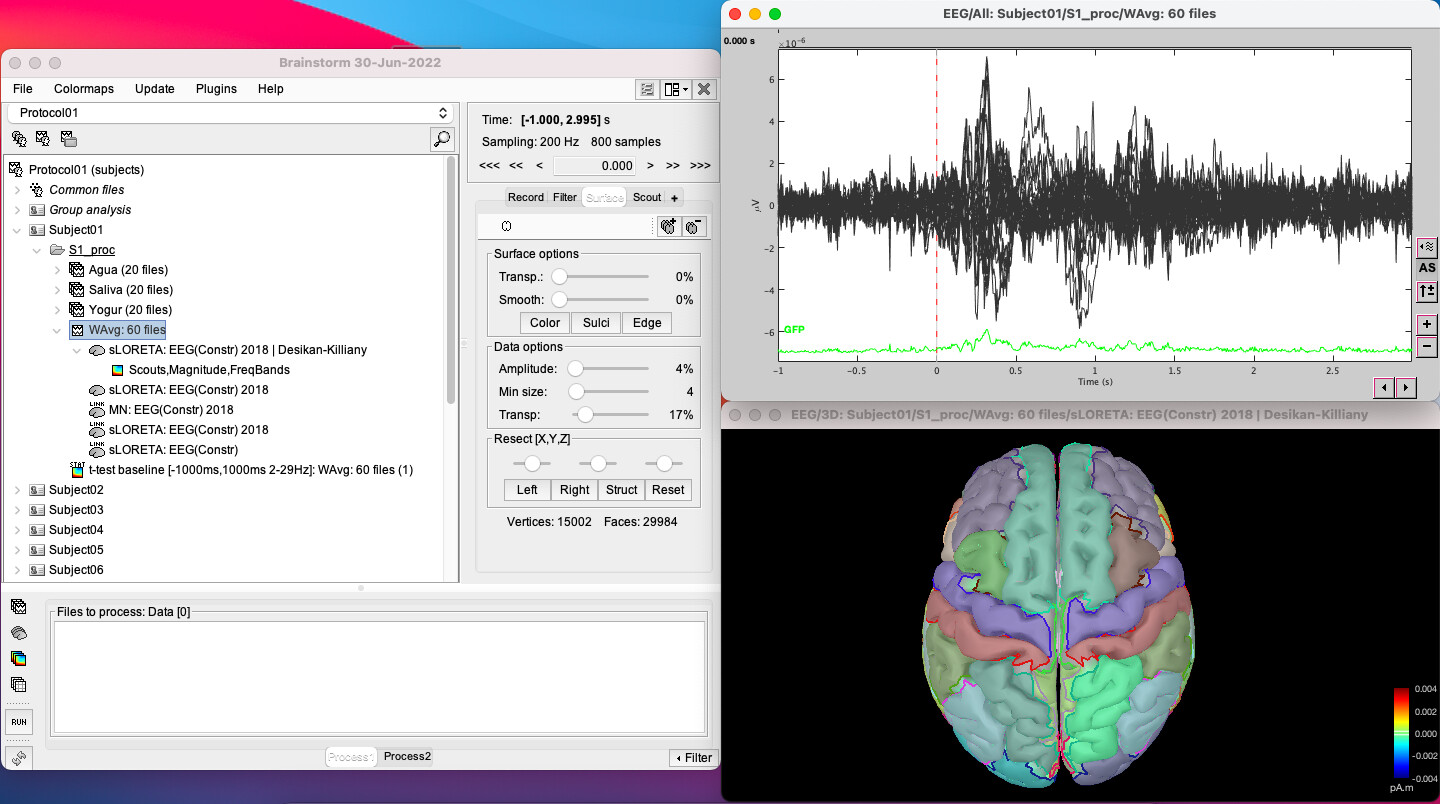
Compute sources sLoreta + Desikan Killiany
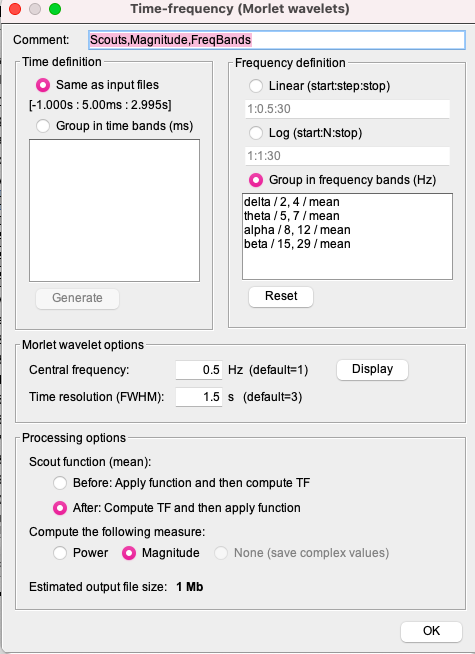
- Then I do the time frequency decomposition as I explained in the reply before and this is what I obtain
Unless you are looking for time-locked and phase-locked changes of oscillatory components wrt to the event at t=0s, I would recommend you do the ERS analysis for each trial separately before average their outcome across trials. But see also my previous note re: the importance of using identical parameters b/w software, if you wish to ascertain consistency.