Dear Francois,
I found very helpful information in the forum regarding ERS\D of time-frequency analysis. However, in my experiment I would also like to calculate the ERS\D of the frequency analysis. I have two experimental and one control (=baseline) conditions. To achieve this aim, I wonder if the following steps are correct:
- import and epoch 3 conditions separately,
- calculate PSD for 3 conditions separately,
- insert PSDs of baseline condition in file A, and PSDs of first experimental condition in file B in process 2 (the same for second experimental condition),
- run event related perturbation (ERS\ERD) for experimental condition based on baseline condition (baseline = all file; because there is no any time domain),
- compare ERS\D of two experimental conditions in process 2, by running a paired t-test.
Cheers,
Mojtaba
Hello,
Yes, I think this is correct.
Running the ERS/ERD process on those two files (A=baseline, B=condition1) will compute an error measure between B and A.
You can get exactly the same results if you run the process “Other > Run Matlab command” and enter the operation:
“Data = (DataB - DataA) ./ DataA .* 100;”
(There is a typo in the comment of the ERSD process, it says “(m-Data)./m” but what is calculated is “(Data-m)./m”, I will fix this today)
Cheers,
Francois
Hi,
Thanks for the quick response. The code you sent me works quite well. Also when I check "all file" as baseline, I am not getting any error. Is it correct as well?
In process 2, I should have the same number of files in both panels. Does it mean that the files are compared one by one to each other (trial 1 in "file A" to trial 1 in "file B", and so on)?
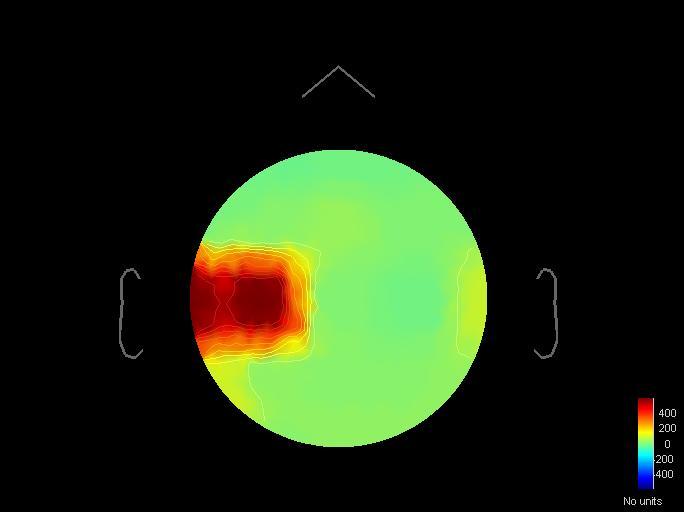
My other question is regarding the scale. As can be seen in the attached file, the scale is not based on percentage, which is needed for ERS\D. Shall I change it manually or it is because of any error?
Sorry for many questions.
Best,
Mojtaba
Also when I check "all file" as baseline, I am not getting any error. Is it correct as well?
Yes, this is correct, but it is more of a trick...
As this is not really an event-related perturbation measure, I would use custom code (with "Run Matlab command") rather than the process ERS/ERD.
In process 2, I should have the same number of files in both panels. Does it mean that the files are compared one by one to each other (trial 1 in "file A" to trial 1 in "file B", and so on)?
Yes, it computes between A(1) and B(1), then A(2) and B(2), etc.
If you have N pairs or files in input (N files in A and N files in B) you will get N files in output.
As can be seen in the attached file, the scale is not based on percentage, which is needed for ERS\D. Shall I change it manually or it is because of any error?
This is a limitation of the current interface: the units are not saved in the files...
Whenever you see "no units", it just means that there is no factor to apply to the data. What you see in this figure are values between -400% to +400%.
Great! Many thanks Francois for your support 
Cheers,
Mojtaba