Hi Brainstorm team,
first of all thanks for your effort in managment and implementation of the software, really amazing.
I write to submit this problem.
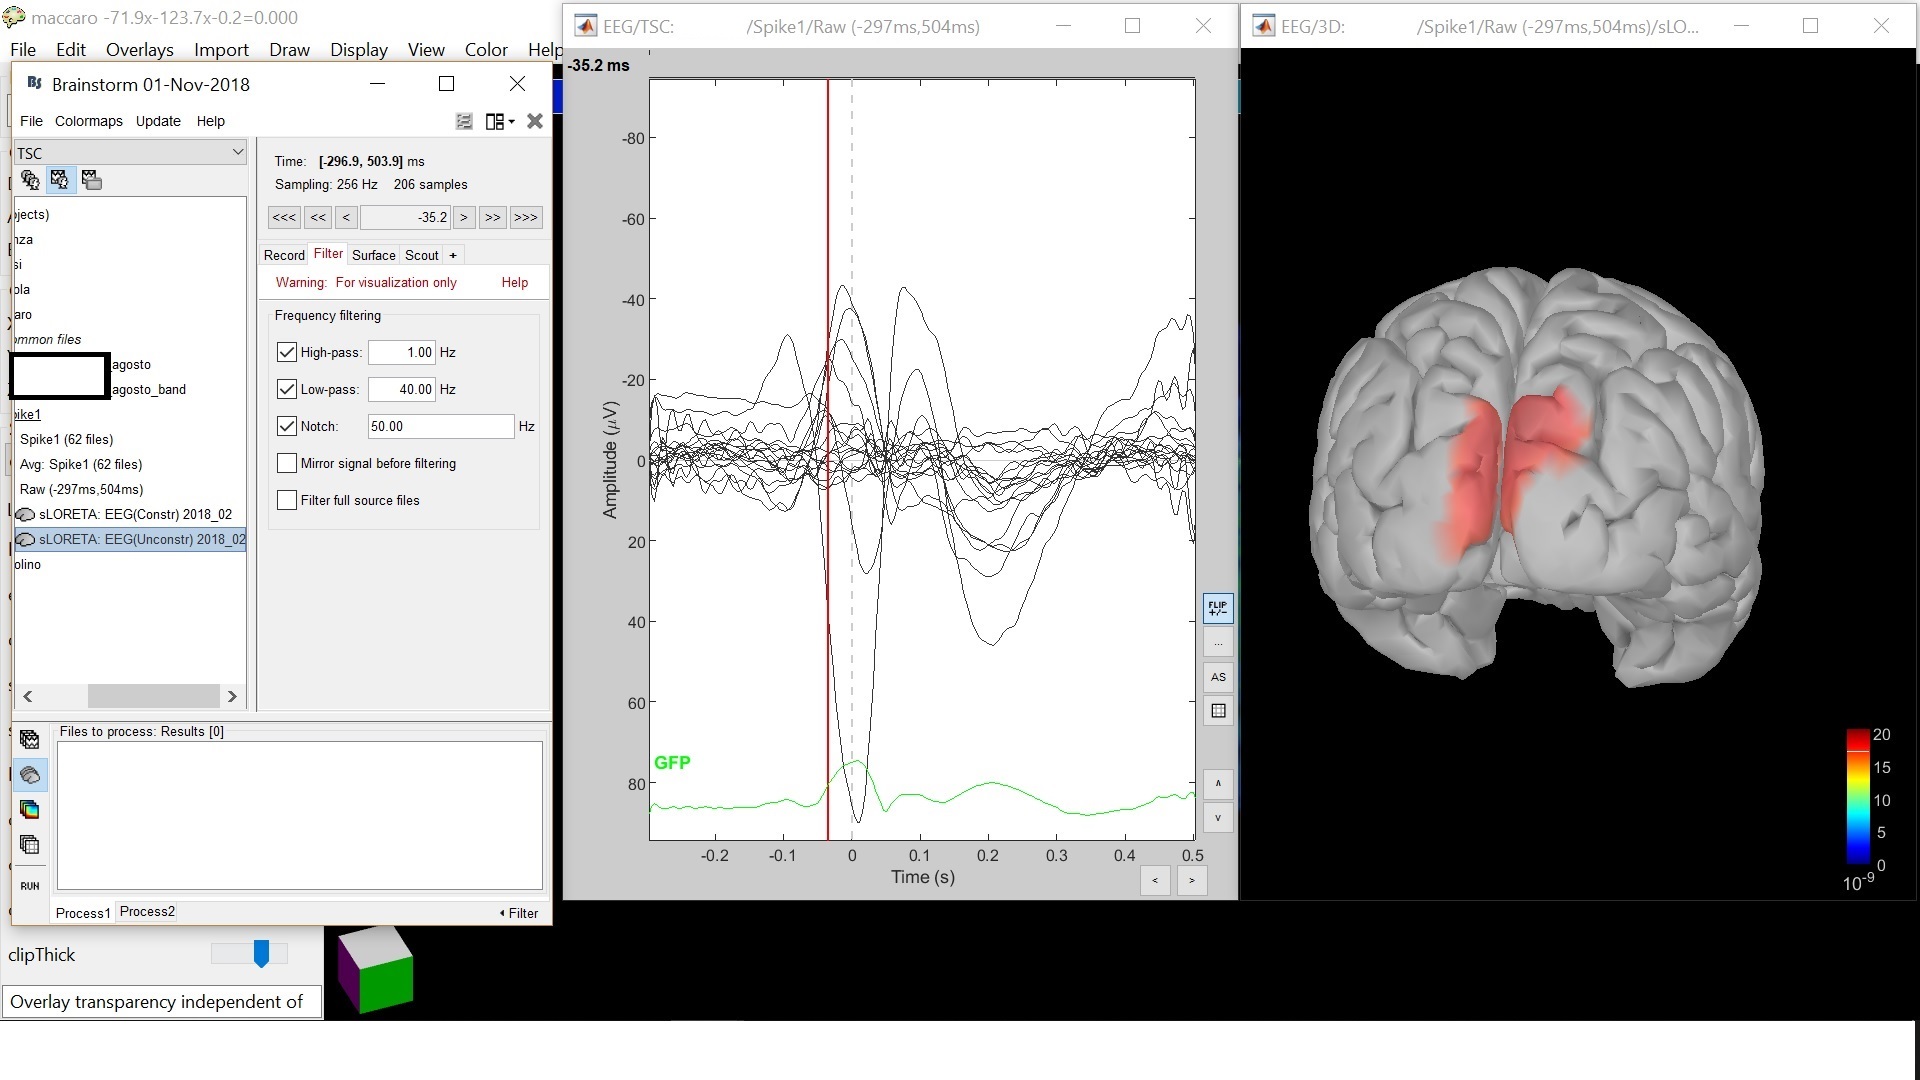
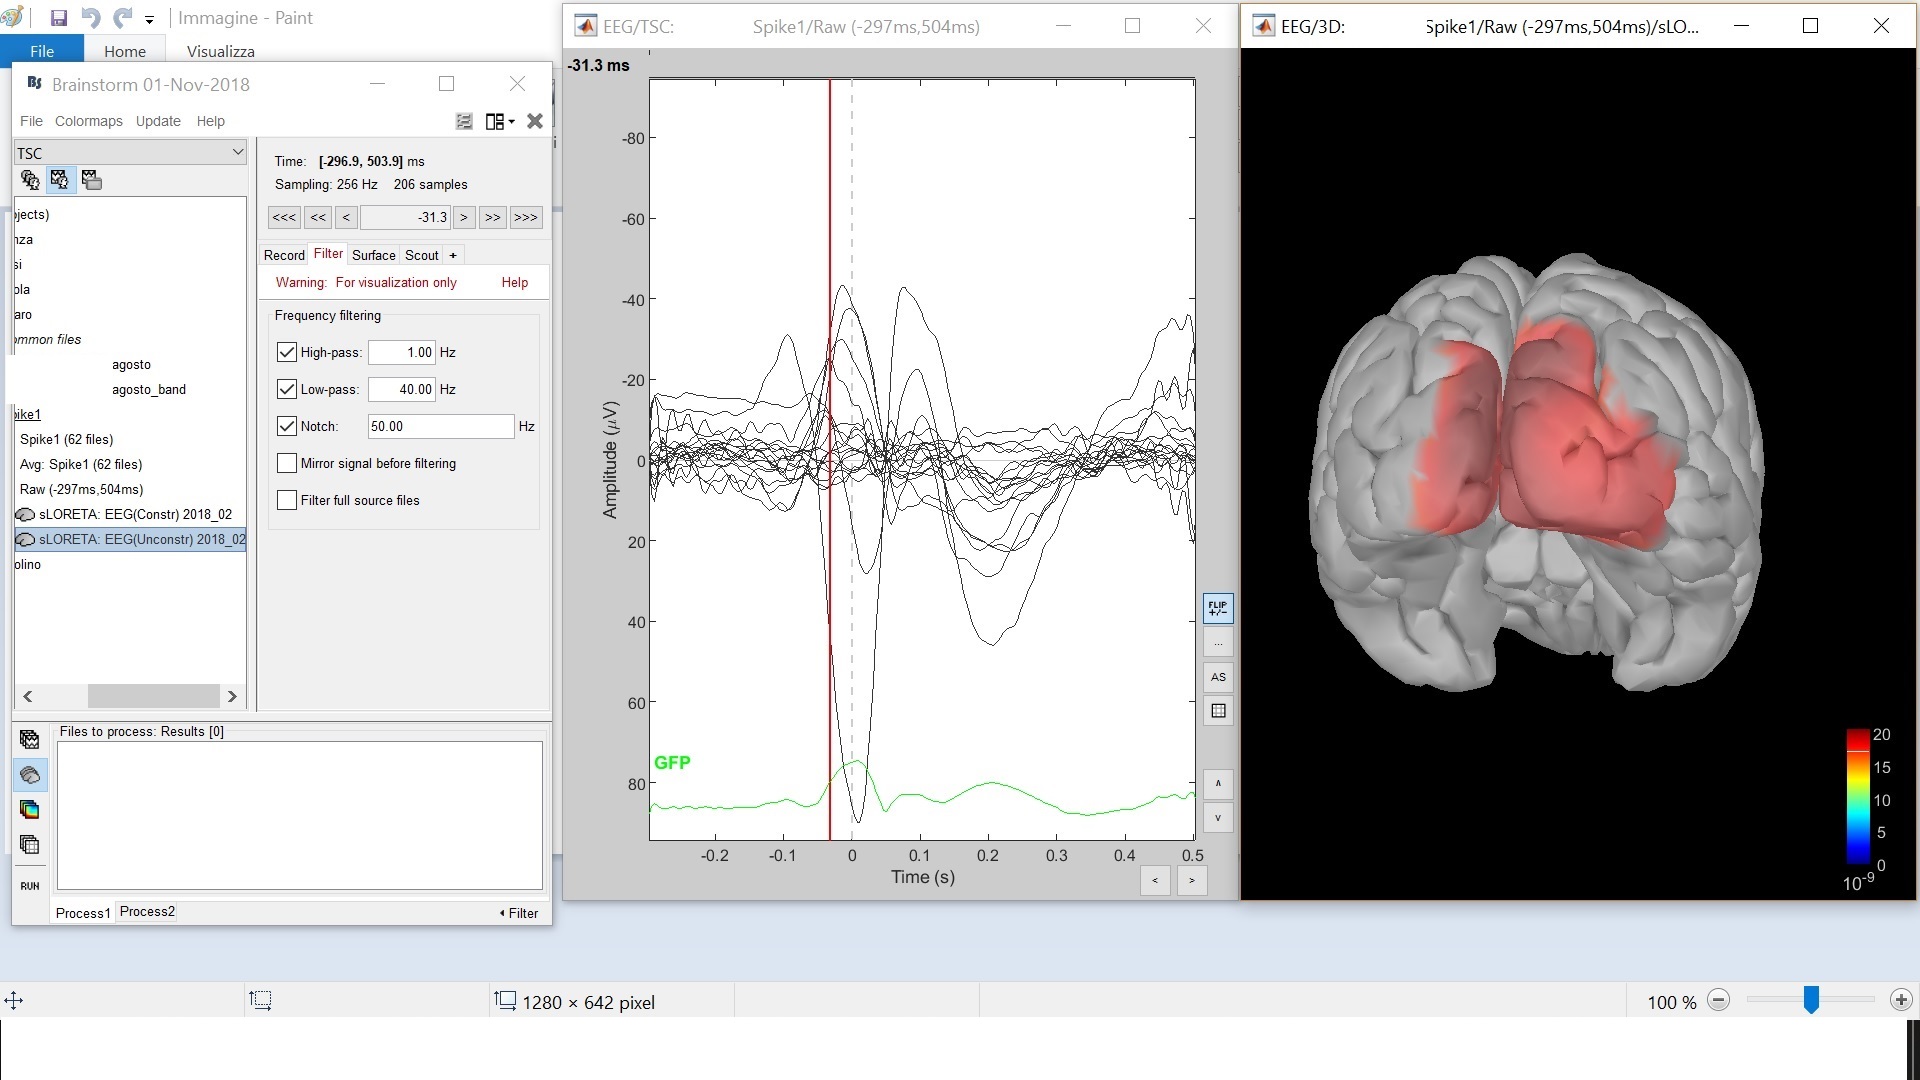
I performed source localization of an avarage of 64 spikes, I'd like to localize to half and to the top of AVGspikes; here screenshots:
!
Then I try to export the two volumes to SPM12 to make statistical analysis in FSL, but activations in .nii that forms, doesn't correspond in activations shown in Brainstorm.
Am I doing something wrong? How have I to set time window, since i'd like to localize in an exact time (for example 0.0 msec for the top of spike) and not in a window?
Thanks in advance.
Regards,
Matteo
Hi Matteo,
If you set the time window option as [0,0]ms, it should export as a volume the source maps at 0ms (what you should in your last screen capture). Then adjust the parameter “volume downsample factor” to the size of the volumes you want to get.
When exporting the source maps to a volume, Brainstorm interpolates the surface source maps to the MRI volume, then saves this volume in a .nii file. To compare visually what you have in Brainstorm and what you see in the .nii, in Brainstorm you should display the source maps as a volume: right-click on the source file > Cortical activations > Display on MRI (MRI Viewer).
If what you see in there is obviously different with what you see in the 3D view, or with what you see in the exported .nii, please post screen captures illustrating these differences.
Cheers,
Francois
Hi Francois,
Thank to your clue I realize that lack of correspondence between Brainstorm MRI viewer and .nii file, was because I expected to have a .nii file with an amplitude treshold applied as in Brainstorm.
Does the “SPM12 export volume process” extract a .nii file only without an amplitude treshold (treshold “0”)? Can you confirm?
In fact setting amplitude treshold “0” in Brainstorm I have a fully corrispondence with the .nii source volume file.
So then have I to set the treshold directly in SPM/FSL?
Thanks for your dedication.
Cheers,
Matteo
Indeed, the source maps are export without any threshold.
The threshold you are talking about (slider “Amplitude” in the Surface tab) is a visualization threshold, in % of an arbitrary maximum, and should not be used for anything but visual exploration.
Your statistical threshold, which will tell what is significant and what is not, is something you will get out of your statistical analysis. You should not threshold your maps in anyway before your statistical analysis.
Everything clear.
You’ve been very helpful.
Thank you.
Regards,
Matteo