I was tyring to extract the time series of a scout, as I did several times before.
Right now I encounter the problem, that the values I extract (through the process tab) do not match the displayed values at all.
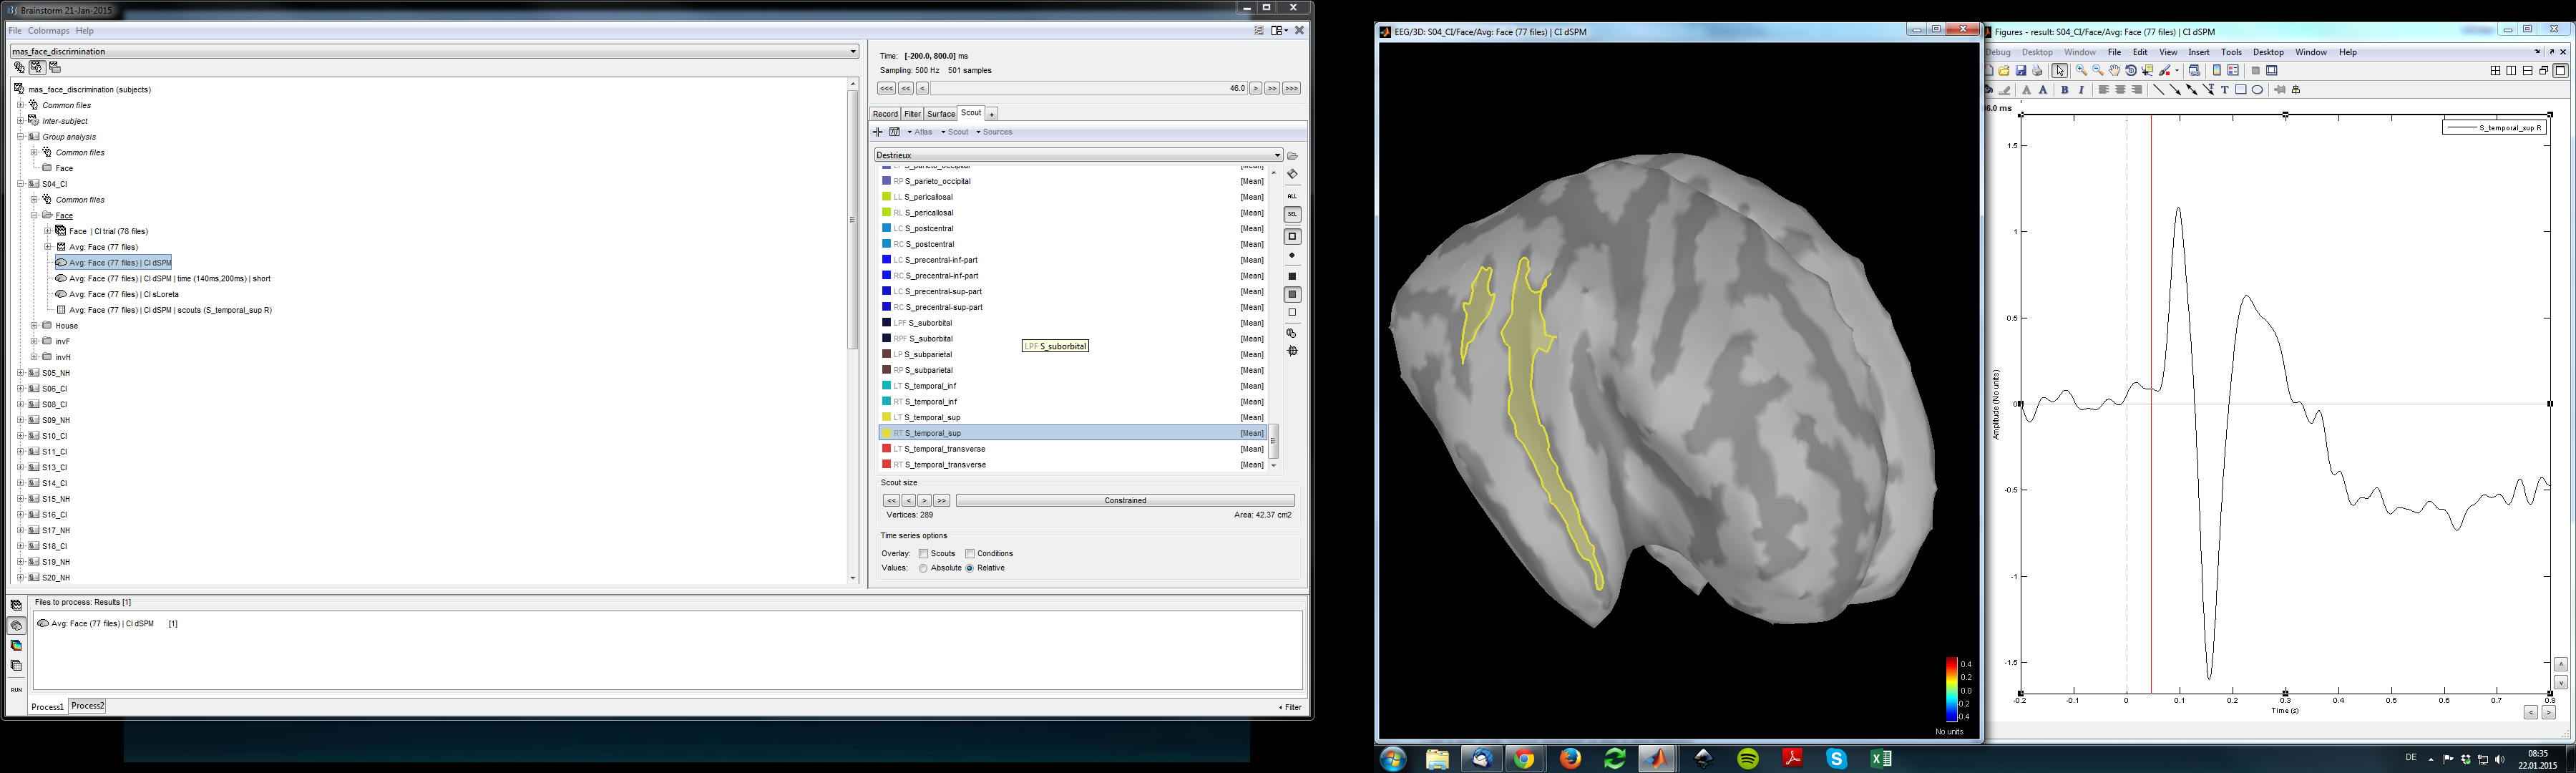
If I look at the image of the scout and display the time series (with the “Display time series” button) I see plausible values. If I export these values to Matlab, they are identical.
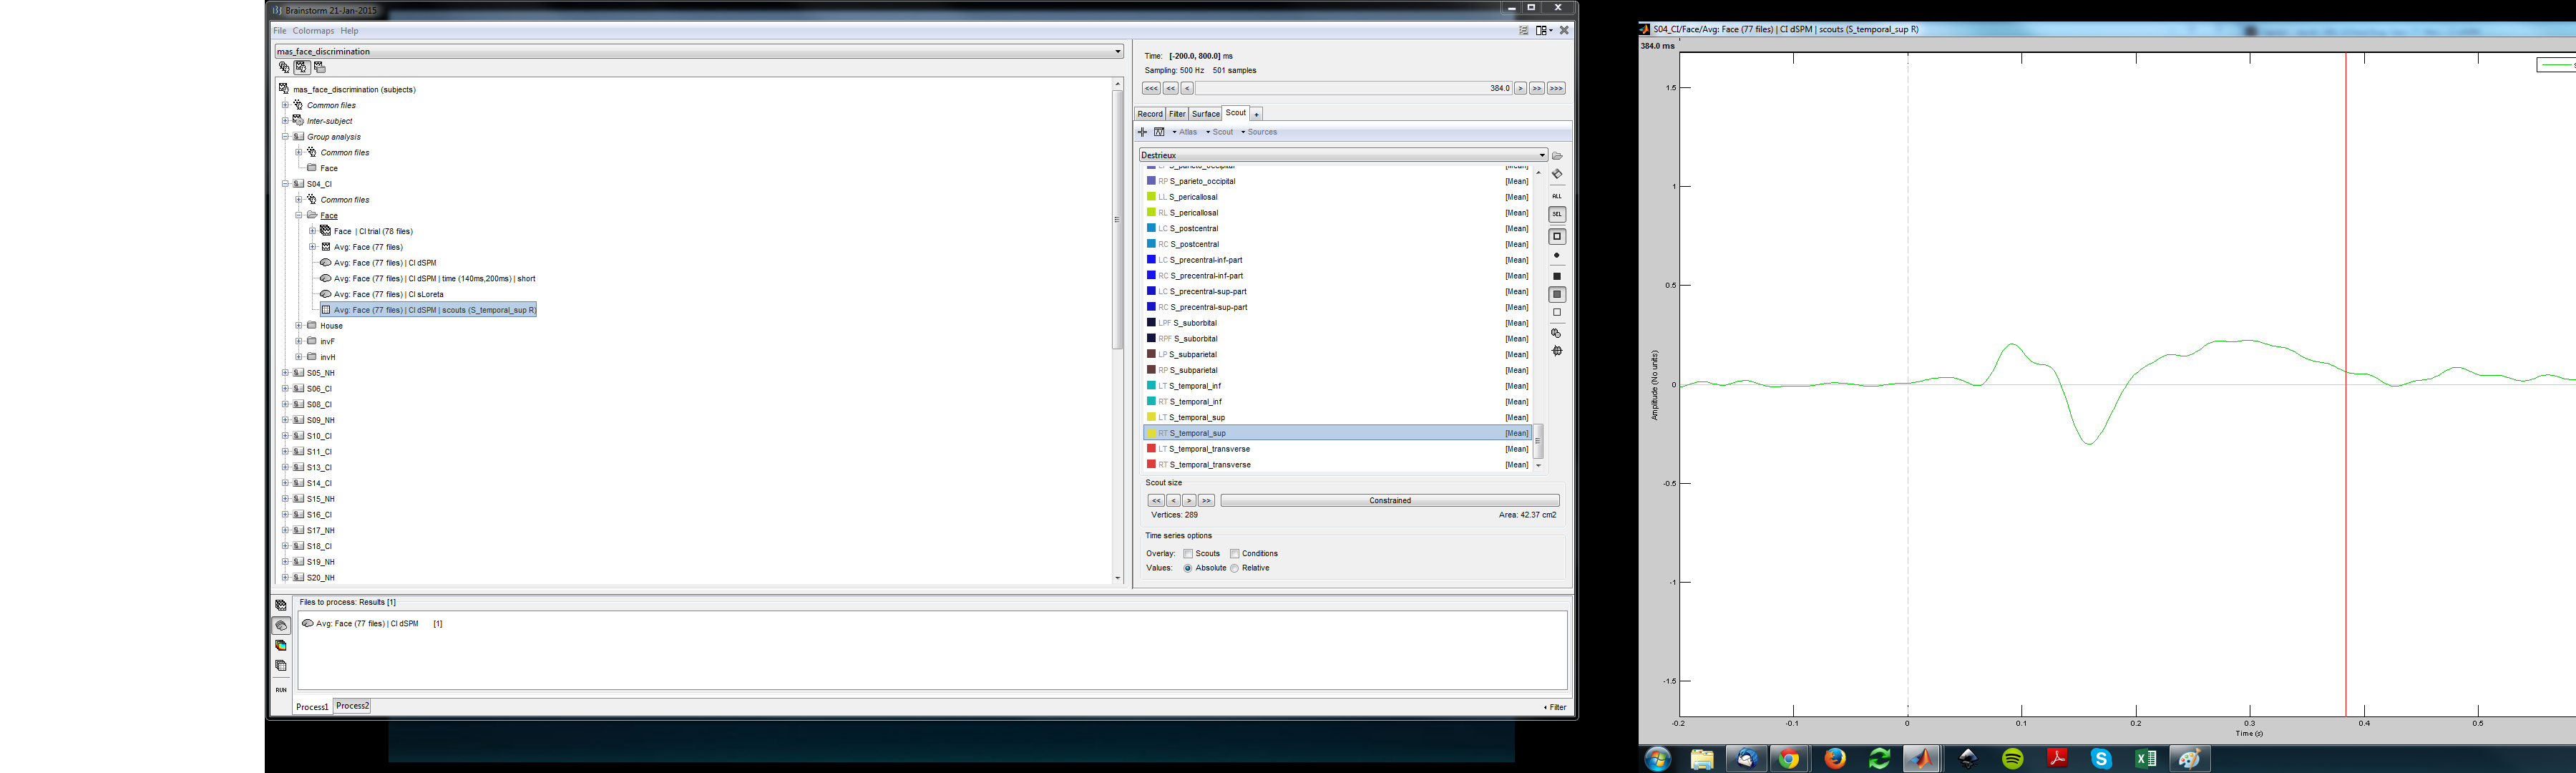
But if I use the process tab to extract them I get totally different values.
Do I make anything wrong or is there a bug?
I get a new node “Group Analysis” is this a new feature?
The new subject “Group analysis” now replaces the node “(inter-subject)”. It allows more flexibility, it adds mainly the possibility to create sub-folders.
This is where the results of any computation involving multiple subjects would go (example: grand average for one experimental condition).
I tested again briefly and it doesn’t look like there is any difference between the scout values generated interactively from the Scout tab, or from the process “Extract scout series”.
Have you made sure that the computation options in the pipeline editor match the display options at the bottom of the Scout tab.
By default the scouts are displayed using the option “Absolute”, while the real relative values are exported when using the process.
There is also always the option of a bug in the software…
If you can reproduce this mismatch, can you post on the forum a few screen captures of your entire desktop to show the files in the databases, all the options and the figures? This would be a good first debugging step.
I tested it again. I still find this problem but not for all the scouts.
I tried it with the S_temporal_sup and the differences is relatively huge (see pictures). I found some scouts that were not affected and some that were.
I did that earlier with my data and I got the right results, I only encountered this problem after one of the last updates.
I added some screenshots. Maybe I am just confusing something.
I don’t manage to reproduce this on my computer.
Could you send me the data for this subject so I can investigate this problem?
Right-click on subject “S04” > File > Export subject
Hopefully the .zip file it creates is not too big (<2Gb) and you can upload it somewhere
If it is too big, duplicate your subject first (right-click on S04 > File > Duplicate subject), delete the conditions other than “Faces”, keep all the files in “Common files”, and export this copied subject
Upload the file S04.zip somewhere (from example dropbox) and send me the link to the file in a separate email (click on my username on this forum).
This was a bug indeed… A very sneaky one, very difficult to detect and reproduce.
In the two versions, the same list of vertices was read and averaged, but the sign flip that is applied to compensate for the opposite orientations in large ROIs was not performed in the same way.
The combination of factors was the following (I’m describing in details them for future reference, you don’t necessarily need to understand all of it):
In your Destrieux atlas, the vertices of the scout “S_temporal_sup” were not sorted by increasing order of indices the way they are supposed to be (was it imported more than a year ago? or are you using an old version of FreeSurfer?)
In the recent version of function process_extract_scout (Nov 2014), the list of vertices was sorted again before extracting the scouts values, but not before getting the orientations of the dipoles from the cortex surface.
In bst_scout_value, for constrained source models, the signs of the sources might be flipped according to their orientation. But in this case, it was not flipping the correct ones.
I guess in most cases, the wrong flipping of a few vertices would not change much the results. But because your region is very large and with very heterogeneous orientations, the result ended up being quite different.
The correct result was the one obtained in the interactive way.
I fixed the process “Extract > Scout time series” so that it sorts again the vertex indices. I also fixed some other functions to prevent these unsorted lists of vertices to be saved in the atlases in the first place.
You can update Brainstorm again, it should be work now (I may have introduced new bugs).
Thank you very much for taking the time to help me fix this bug.
I have two more remarks about your database:
a) The average of the sources is supposed to be the same as the sources of the average. I’m not sure why yours are different and why you recalculate explicitly the average of the sources.
b) Most of the regions coming from the atlases are very large and have shapes that you would naturally design as a region of interest. If you average the signals over large regions, you can lose a lot of the signals of interest. You could also try comparing your results with what you would get with smaller scouts, either hand-drawn or resulting of a sub-parcellation of an existing anatomical atlas.
Thanks a lot for the update, it seems to work ! And thanks for the explanation. My atlas was not imported more than a year ago but maybe my freesurfer version is older.
I don’t really know what you mean with your comment about the average of the sources and the sources of the average.
The sources of my average recording file are calculated automatically, right? But you told me once that I should calculate my average source from the single trial sources. That is what I did. But I don’t see why they differ? If I open the time source of a scout they are perfectly overlaid. So it wouldn’t make a difference which one I use, but I always use the average sources based on the single trial sources.
Do I get something wrong here?
Both files should be [B]exactly[/B] the same if you used the option “arithmetic average” in the average option, with the difference that the default options for the colormap scaling might be different. In the case of the files averaged from the sources of the individual trials, we have all the values and can get the real maximum of the file.
In the case of the “link” created automatically for the averaged recordings, the source values are never calculated explicitly for all the time points. The real maximum of the file is not calculated but roughly estimated, to have a faster file display. The default colormap bounds can be different than for the other file.
If you want to check if the values are the same on the cortex, you can set a fixed colobar range in the colormap options.
For one source model (= one channel file), the two ways of calculating the average should be exactly the same. The “link” attached to the average trial is already there, it does not require any additional calculation step, plus it opens and display faster and many advanced processes are optimized to work on this compact representation (recordings + imaging kernel). In this case, I do not recommend you re-calculate explicitly the average of the sources for the individual trials.
When you want to average sources from different subjects (or different sessions in MEG), you have different channel files/head positions, you need to mix different source models. In this case, the two approaches are not equivalent (average(sources) ~= sources(average)), to get an accurate result you need to average the source values.
Let me know if you need more explanations.
Cheers,
Francois
Ok, I do get the difference and that it is only important if I want to average multiple subjects. For that reason I calculated the single trial average (of the sources), because I wanted to have a group average (as you mentioned).
But in the single subject case, the two froms of average don’t make a difference don’t they? I mean in my special case of data I sent you I don’t see any difference. I am just a bit confused because I understood that you found a difference but I don’t see it ( I am specifically talking about the data I sent you).
What you should do in the case of the multiple subjects:
Import all the trials
Calculate the noise covariance based on all the trials, and estimate the sources
Calculate the average of the recordings (not the sources) for each subject individually => you will get a source link as well for this average
Average these source links across subjects
In the files you sent me, I thought the two averages were different, but it was just because of the configuration of my colormap. They are indeed exactly the same.
I estimated the single trial sources as you said but then averaged the single trial source estimates for each participant. I then use the subject average to compare my subjects (in SPSS). So this is one processing step in addition that might not have been necessary (thanks, so I know this for next time!) but that should not change my results if I get you right?
Sorry for all the confusion!
I only use the group average for display purpose so it should be ok.
 And thanks for the explanation. My atlas was not imported more than a year ago but maybe my freesurfer version is older.