I would like to know if there is a easy way in BS to flip left-right MEG sensor or source data. I see a related post (link below) from 2014, but not sure if anything has been done.
You can find information to flip left-right EEG channels:
In the case of MEG, you should not do any source modeling after flipping the sensors left-right.
For source data: what would you do with this exactly?
Thanks. I understand the issues with flipping the MEG data. I have a set of subjects for whom stimulus was delivered to either the right or left extremity. Consequentially, predominant MEG activity is recorded on the contralateral hemisphere, left hemi for right extremity stimulation and right hemi for left extremity stimulation. I cannot do group analysis unless, all the data is aligned to one side. Whats the best approach to deal with such situations?
In source space, you can define scouts that define the ROIs in each condition.
Depending on the participant, these scouts would be on the left or the right.
Extract and average the scouts time series.
Thanks. However, scouts reduce the spatial specificity of activity. Assuming each source is a tiny scout by itself, isn't it possible to just flip the source times series from one hemisphere to another? I understand the possible implications of head position changes, in that case.
Brains are not symmetrical, neither anatomically nor functionally.
Theoretically: Mapping one-to-one vertices in the two hemispheres for MEG source-level analysis is an abstraction that has little chance of making sense physiologically.
Practically: We haven't implemented this in Brainstorm.
Working at the ROI level, especially if designed in a data-driven way, gives an option to work around both problems.
Excuse me for being an outsider.
I too would like to perform a left-right ROI comparison using source data. Considering that brain function is not symmetrical, I would like to do a left-right comparison of the source data, focusing only on the S1 and M1 regions.
Please tell me how to invert either the left or right region to see the left-right difference.
The comparison in the source domain between different conditions (e.g., left and right) for specific ROI can be performed using Scouts.
https://neuroimage.usc.edu/brainstorm/Tutorials/Scouts#Multiple_conditions
Thank you for your reply.
I would like to use the source data to perform a group analysis of the right hemisphere when exercised with the left hand and the left hemisphere when exercised with the right hand. In other words, compare different hemispheres during different tasks.
Therefore, I selected 4 scouts in the regions related to the movement (postcentral, precentral, superiorpartietal, supramarginal) and did the following.
Put source data in process1➢Extract➢scouts time series➢Select postcentral, precentral, superiorpartietal, and supramarginal in the hemisphere opposite to motion
By doing this, we extracted 4 scouts for each right and left motor. These were done for 30 individuals.
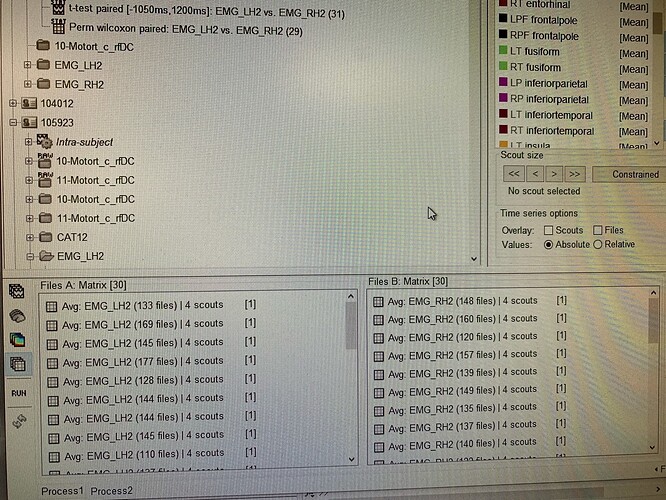
Next, in order to perform group analysis of these matrices, I used Process2 to perform a permutation test:paired with 4 scouts in FilesA during left hand movement and 4 scouts in FilesB during right hand movement as shown in the image.
The results are shown in this figure.
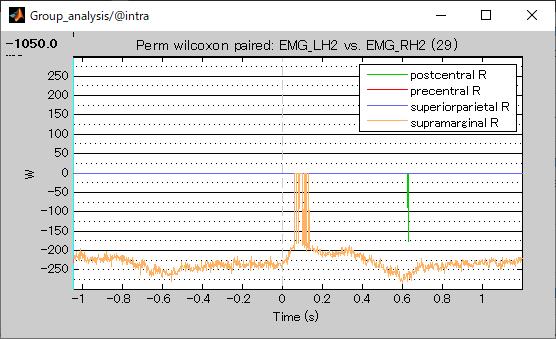
In this result, only the right hand scout is shown for the 4 scouts. Does this result produce statistics with the 4 scouts corresponding on the left and right? (e.g. postcentral on the right and postcentral on the left)
Does this allow you to compare the right hemisphere data during left hand movements with the left hemisphere during right hand movements? What is your interpretation of these results?
Best regards
sakino
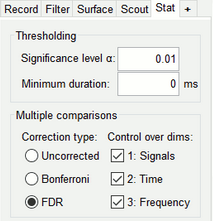
The plot only shows the time samples of Scouts that have p-values smaller-or-equal to the Significance level α value after the indicated Multiple comparisons method is applied.
Thank you very much.
I have an additional question.
As before, I would like to compare the same ROIs in the right hemisphere when moving the left hand and in the left hemisphere when moving the right hand in a group analysis.
In the previous case, I focused on 4 scouts (postcentral, precentral, superiorpartietal, supramarginal), but this time I performed it with 34 scouts in all contralateral hemispheres.
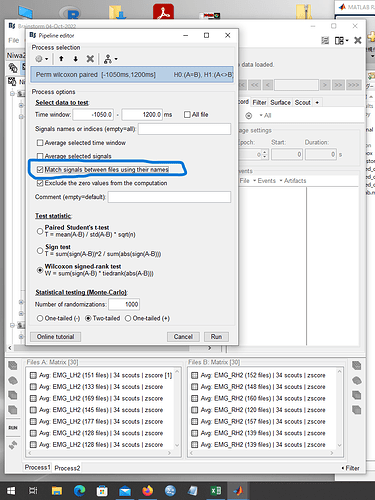
The data from the left hand movements were placed in FileA and the data from the right hand movements were placed in FileB, as shown in the image below, and the statistical analysis was performed as shown in the image.
At that time, I checked the "Match signals between files using their names" box.
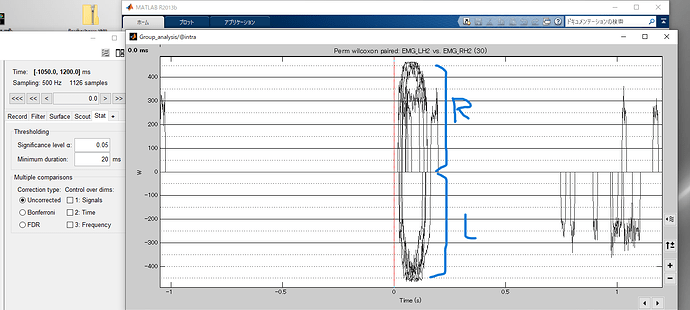
The results are as follows.
Top: presentral R superiorparietal R supramarginal R postcentral R
Bottom: presentral L superiorparietal L supramarginal L postcentral L
As you can see, the same area on the left and right sides appeared on the top and bottom.
Question 1: I found it strange that both L and R appear in the results. Is this a situation where the same scout on the left and right sides cannot be compared?
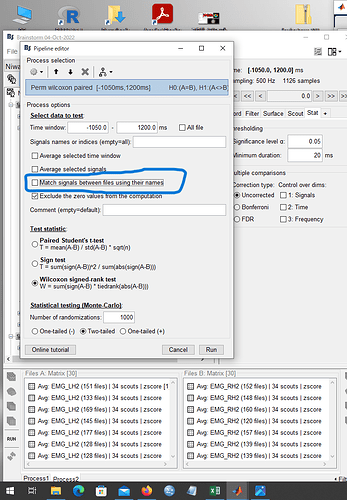
Next, I tried to solve this problem by unchecking the "Match signals between files using their names" checkbox during the analysis. The image is shown below.
As a result, everything was in R and displayed. The result is the image below.
Question 2: The image aboveup.
This shows only R. In this state, are you able to compare the left and right sides of the same scout?
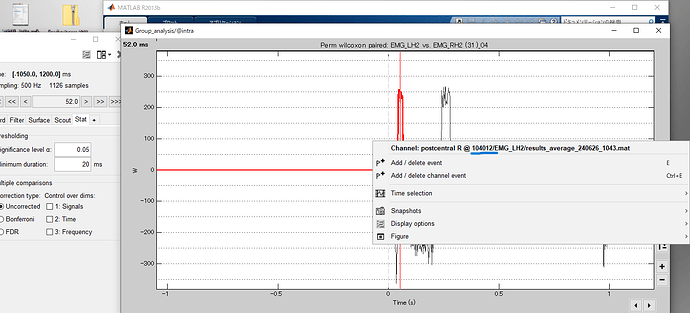
Also, the result shows the examinee number as "104012", but is it just showing the first examinee number? 104012 is the first examinee number.
Best regards
sakino
