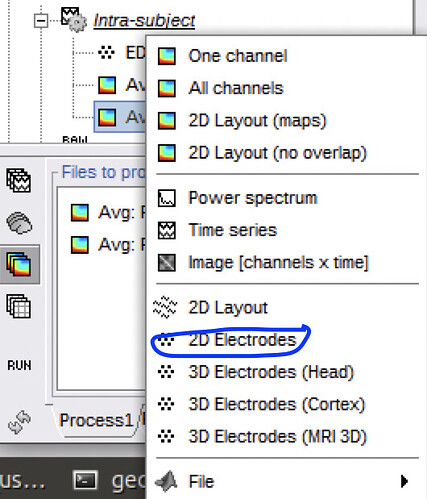
Hello, which is the brainstorm function to display a 'time-frequency' file on 2D electrodes (as we can do through the gui)?
Also, is there a way to understand which function is behind a specific gui option? I've been looking inside the folder 'gui' but it's not always obvious.
Thanks!
Yes! These are some hints on how to find the functions behind GUI menus and buttons:
https://neuroimage.usc.edu/brainstorm/Tutorials/Scripting#Find_interface_callback_functions
In brief: scanning the source code and finding the related function
For example:
Searching for the string "2D Layout (maps)" lead to line 2114 in tree_callbacks, where the callback points to the function:
view_timefreq(filenameFull, '2DLayout')
which is the function you are looking for
Thanks for the very quick response!
I am looking for the option "2D Electrodes" which is different from '2D Layout' and can't seem to find that as display option in the function. Any help? Thanks again
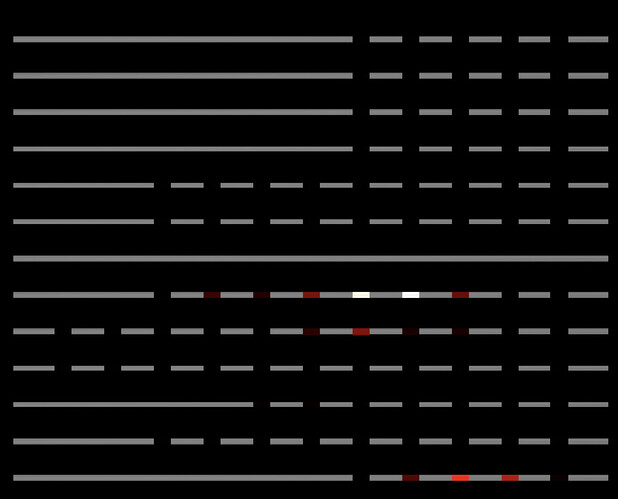
Which is the plot for time-freq that you need?
Do you have a screenshot?
From the image, it is not possible to get if you have SEEG and/or ECOG in your data, thus try the following command with these modalities: either SEEG or ECOG+SEEG
filenameRelative = file_short(filenameFull);
view_topography(filenameRelative, MODALITY, '2DElectrodes');

