Hi Brainstorm Team,
I am working on an EEG study (64 channels, BrainVision format) regarding the effects of cTBS. I am encountering a persistent visualization issue when displaying the Power Spectral Density (PSD) on the Cortex surface.
Data & Anatomy:
-
Anatomy: Individual MRI processed with CAT12. 3-shell BEM surfaces generated (no intersections).
-
Electrodes: 64 channels with digitized positions (.xyz file), correctly projected on the scalp.
-
Processing: 120 epochs (2s each) of resting-state EEG.
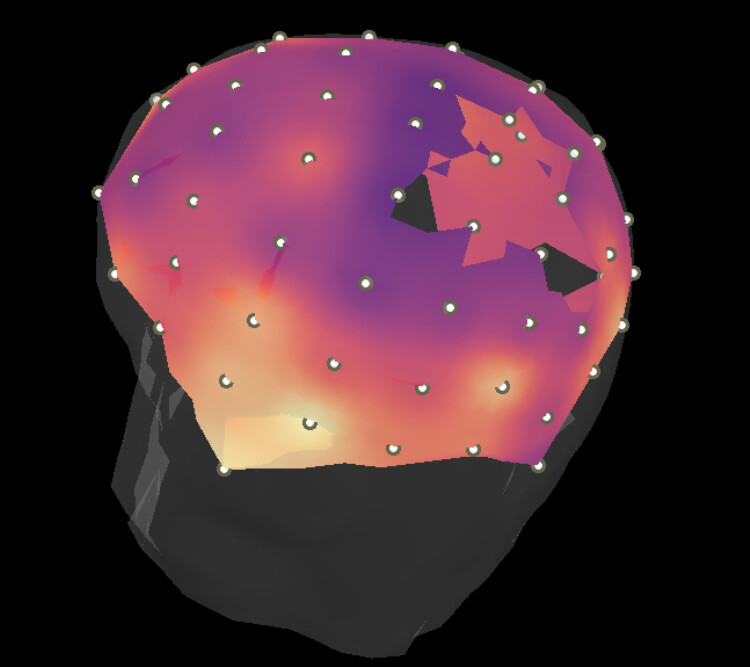
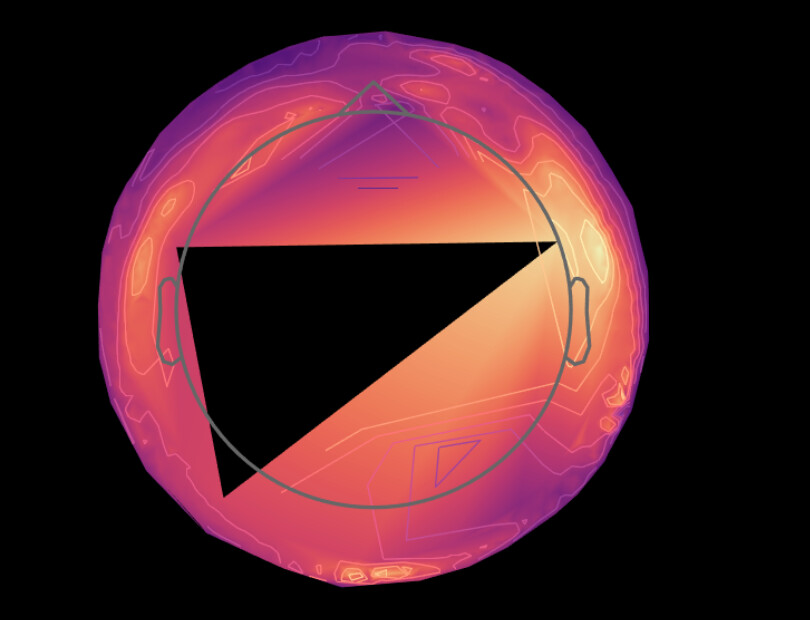
The Issue: When displaying the Welch PSD (Average across trials) on the Cortex (specifically in the Alpha band, a geometric, diamond-shaped void appears in the center-parietal region (near Cz/Pz). This "hole" has no data or is rendered black/transparent, even though the electrodes in that area have good quality signal and are correctly labeled.
Steps already taken:
-
Verified channel names (matching header vs. .xyz file).
-
Tried both OpenMEEG BEM and 3-shell sphere forward models.
-
Re-projected electrodes to the scalp surface.
-
Computed sLORETA sources first, then Welch PSD on sources (Average across trials).
-
Increased "Max distance" for interpolation in the Surface tab.
Any advice on how to "fill" this gap to ensure valid ROI extraction for my dissertation would be greatly appreciated.
Thank you for your amazing work on this toolbox!