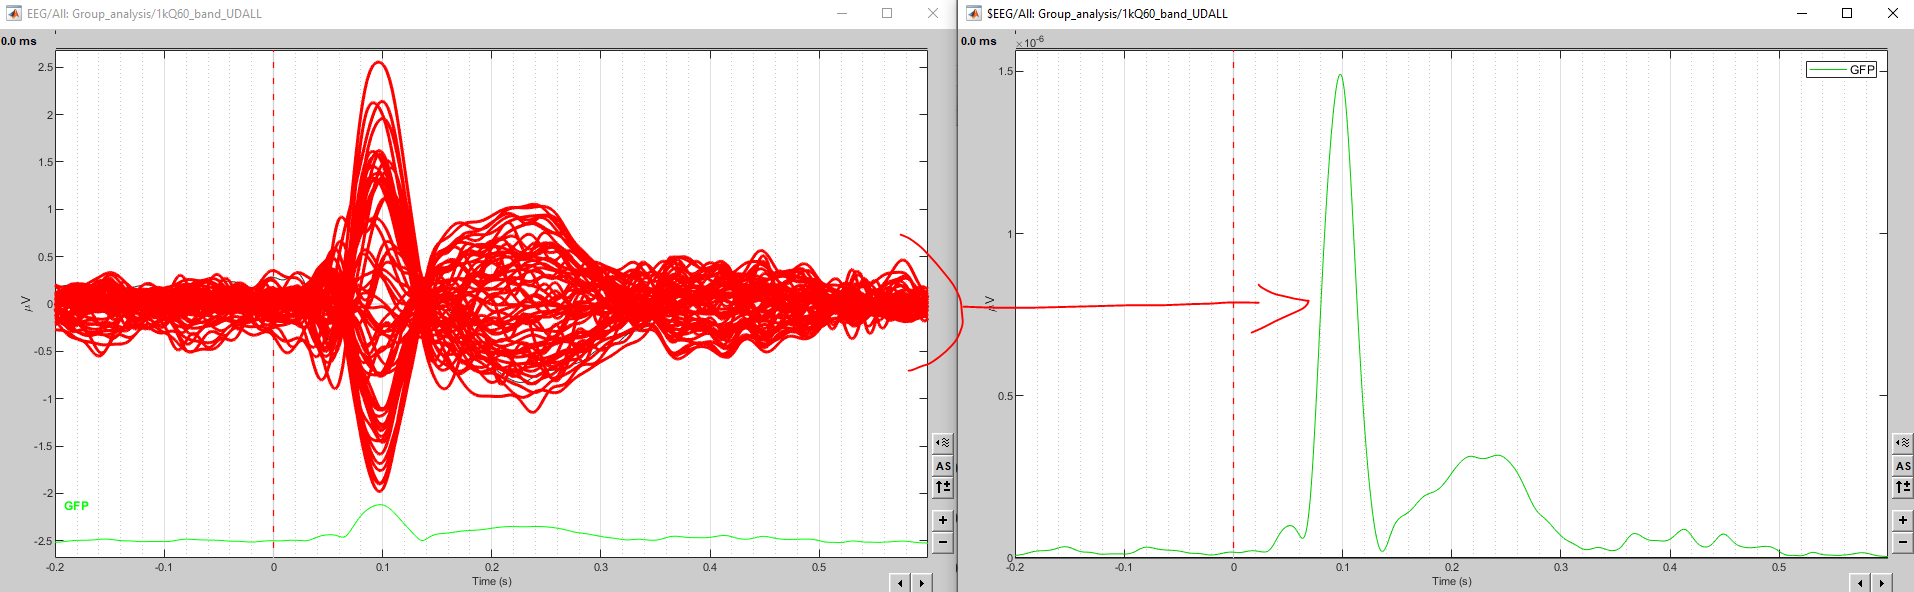
The below diagram shows the result of using the CLUSTER function for POWER to generate the global field power of cortical auditory evoked potentials from 64 channels of electrodes.
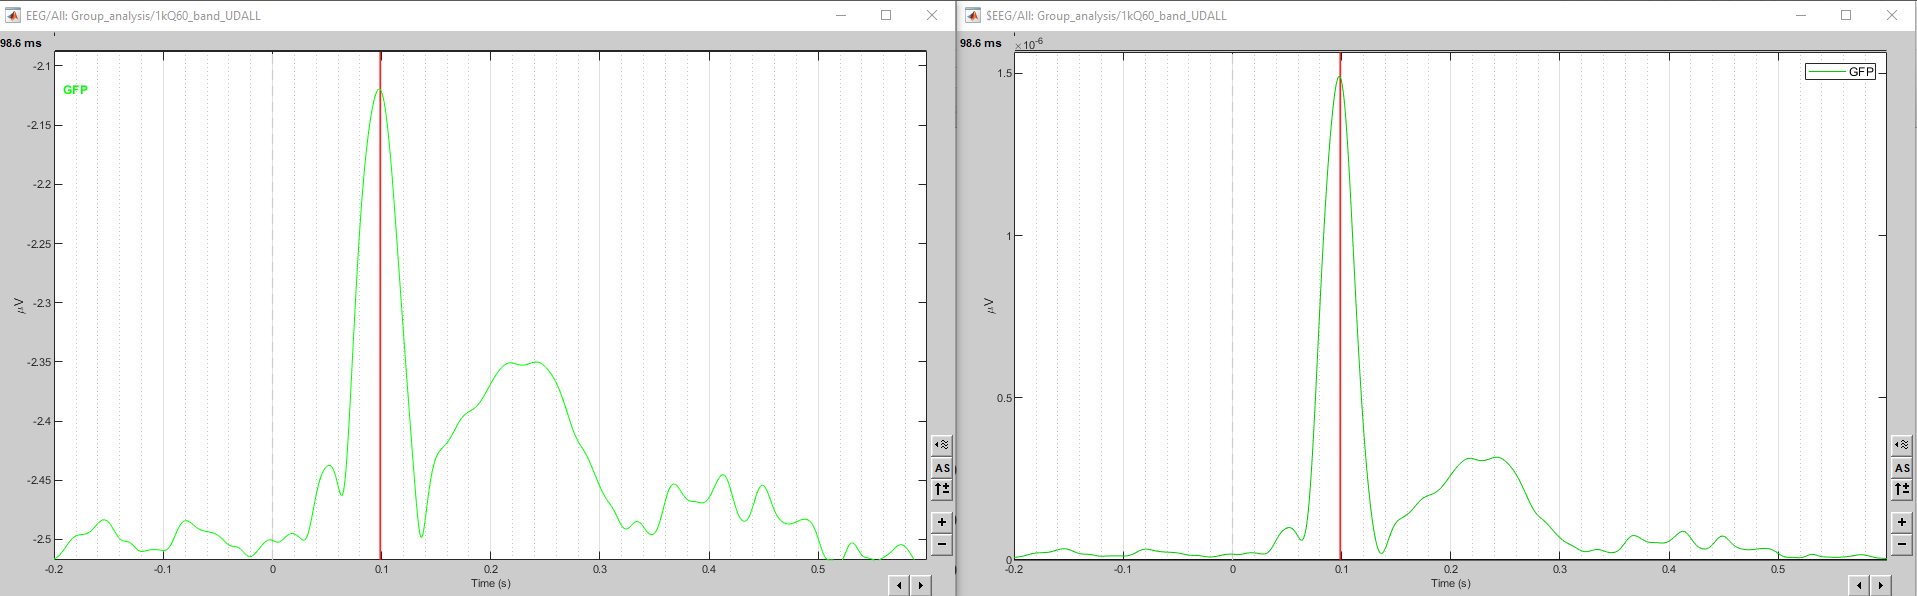
I then enlarged the bottom green GFP trace from the top left figure to see if it looks exactly the same as the figure on the top right figure which is shown below.
I know that the y-axis scale is very different but I still thought that the general shape of the GFP should be very similar (if not identical) between the two figures, but they are not at the moment.
What might be the potential reasons?
Brainstorm was computing a RMS measure instead (sqrt(sum(x.^2)), and then normalizing by the maximum for display (brainstorm3/figure_timeseries.m at master · brainstorm-tools/brainstorm3 · GitHub). The results is usually very similar or event identical as the STD because the mean of all the sensor values is most of the time close to zero (or IS equal to zero in the case of EEG with an average reference).
But to match the most common definition, I updated the code and documentation to use the STD instead: