Hi everyone!
I hope you guys are doing great!
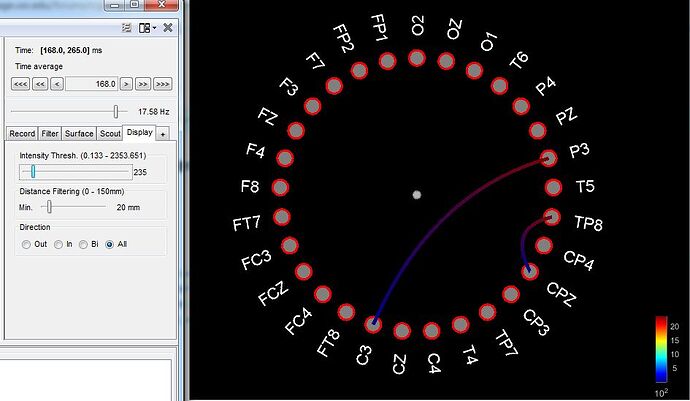
I just want to ask about Granger Causality output values, since I've computed Spectral GC on a ERP (Feedback related negativity) and I got a connectivity graph with weird values, I think these values are extreme but I don't know if it is spected or if I did something Wrong:
Input file was the database imported epochs (-98 - 450 ms), these file has 46 epochs (37 clean)
model order 7
Frequencies: min 1 max 2
time: 168 to 265 ms
remove evocked response (checked)
at 17.58 Hz it shows the max values, but values are over 1000,
I don't know if my approach was right or Should I compute the averaged ERP file instead?
Thanks in advance!
I'm not sure what you can expect from the spectral Granger causality of the concatenation of 37 blocks of 100ms...
@Sylvain @hossein27en @Marc.Lalancette ?
Certainly not: 3.7s worth of data is too short to ensure proper/robust estimation of model parameters.
I see,
actually each block was 550 ms
and windows time for analysis was from 168 to the 265 ms position (to catch the ERP)
too short?
Yes. please refer to Florin et al. and other methods paper that provide practical guidelines for best-practice of connectivity measures such as Granger. Removing the event-related component - an option in Brainstorm - would also be required, otherwise the Granger estimates will be entirely driven by this latter.
