I have been using your EEG graphical interface for a while. I is works fine, but I just have 2 suggestions:
when reviewing bad channel events, it is very hard to identify selected bad channels when we have many channels (it would be great if they could be highlighted somehow (the colored patch is somewhat misleading)
when reviewing the EEG data it would be useful to use arrows instead of the scroller at the bottom.
Hi @Annie, thank you for your feedback it help us to keep on improving Brainstorm.
This is an interesting feature, it now implemented in Brainstorm, commit f10f701.
Update to the last version to have the feature).
If an event is defined for specific channels, those channels are selected (in red). Moreover, by pressing Enter a new timeseries figure will appear with the culprit channels.
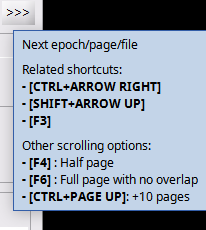
This is possible to do with Ctrl + Right/Left arrow.
There are additional options for time-scrolling the data, just hover the mouse over the [>>>] button to see the options.