Hi Brainstorm forum!
In our lab we are using Brainstorm to compute Phase Locking Value but we have a doubt, while testing various frequency bands we realized that the resulted figure showed a high PLV value (almost to 1) at first and then drops to 0.1. This seems to be an artifact due to the fact that happens in every band and it lasts longer when changing the data points. E.g. in the case of theta (800 data points) it would last for almost 800msec (with a downsize sample of 1000Hz), while for gamma band (50 data points) it would last for 50msec.
Do you think could be an artifact? Are we missing something maybe? Sorry and thank you so much for any info you can give us!
Can you please post screen captures of:
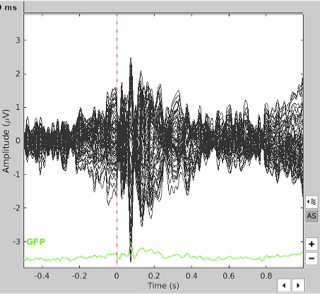
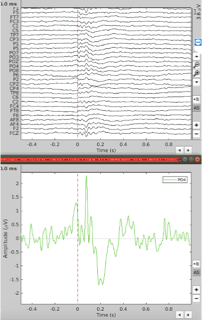
- the recordings you have in input (2-3 example epochs if many)
- the PLV plot you don't understand
- the PLV process options
- the Brainstorm database explorer with the input files and output PLV file visible
Hi Francois, thank you for the response. We tried both with an external script (https://praneethnamburi.com/2011/08/10/plv/) and with Brainstorm with the GUI extracting average PLV on 3 time-points (300msec each) for each frequency band.
Even with Brainstorm we have a doubt.
Slower frequency (such as delta-theta) always show a significant higher PLV (around 0.98-0.91), while faster frequency such as gamma1, gamma2, and beta show a PLV always around 0.5, with alpha in between (PLV around 0.7).
Do you maybe know if this is normal in PLV studies (maybe due to the problem of the volume conduction)?
Thank you so much.
Best,
Sara
Hi Sara, @RomanellaSara
Sorry for the delayed response.
When using the connectivity measures you should always consider several points.
First, since low-frequency oscillations have a smaller number of cycles than high-frequency oscillations for the same signals, the SNR might be lower for them, especially when the signal is not long enough.
Second, FIR filters in low frequency usually have a longer transient response than those in high-frequency bands. That's why in low-frequency the early part of the analysis might not be very exact, due to the filter effects.
Third, in natural brain recordings, it is normal to see larger values for lower frequencies due to several reasons like volume conduction or the nature of brain signals. That's why you should be more interested in the relative changes (before and after stimulation or between two conditions) rather than the absolute values.
Hope this helps,
Hossein
Hi Hossein,
Thank you for answering me. We are very confused. The pattern seems to be too stereotypical to be explained by volume conduction and normal differences in cortical oscillations.
To understand we also computed the same PLV at the same time-windows with Fieldtrip and see very different and more variable results (ranging from 0.1 to 0.9, while all the PLV scores in theta we had were around 0.96-0.98). I know Brainstorm uses a Hilbert transform while Fieldtrip start the computation with a wavelet transform.
How do you think this affects the results and creates two outputs so different?
Thank you in advance.
Best,
Sara
We'd need more info to help out better: please post screen captures of the time series you are computing PLV from.
Hi Sylvain, thank you for answering. I attach some screen shots as an example but please let me know if this is what you needed, otherwise I can provide the missing data. What do you think could cause this stereotypical pattern?

