I need to know the plv between two scouts i selected in the way of time series.but i met some problems.
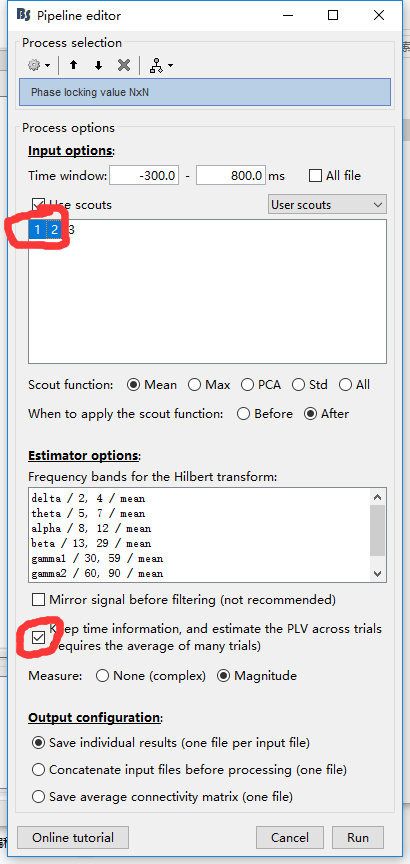
1:I choose two scouts in the plv(n*n) interface,and select the item(keep time information,and estimate plv across the trials),but finally i got the plv between the
two scouts ,the result is always 1.it seems like impossible,so i tried not selecting the item(keep time information,and estimate plv across the trials),i got resonable result,but that's not what i need ,i need timeseries' result.
2.if finally i got reasonable results in the way of timeseries,can i switch the result graph to the like this:let time variable as x-axis,and frequency as y-axis?
Have a nice day!
With the present implementation of BST’s GUI, the best way to obtain a connectivity measure between scouts is to run a 1xN process such as PLV, select one scout as reference. The PLV with the rest of the brain is then computed and you can extract the PLV between the scouts using the scout panel features.
Thank you! another question ,i met a problem in computing plv 1*n connectivity when i choose one of the item:‘keep time information ,and estimate the plv across trials(requires the average of many trials’,the connectivity results is always 1,between all scouts.if i did’t choose the item:‘keep time information ,and estimate the plv across trials(requires the average of many trials’,the results seems more resonablely!
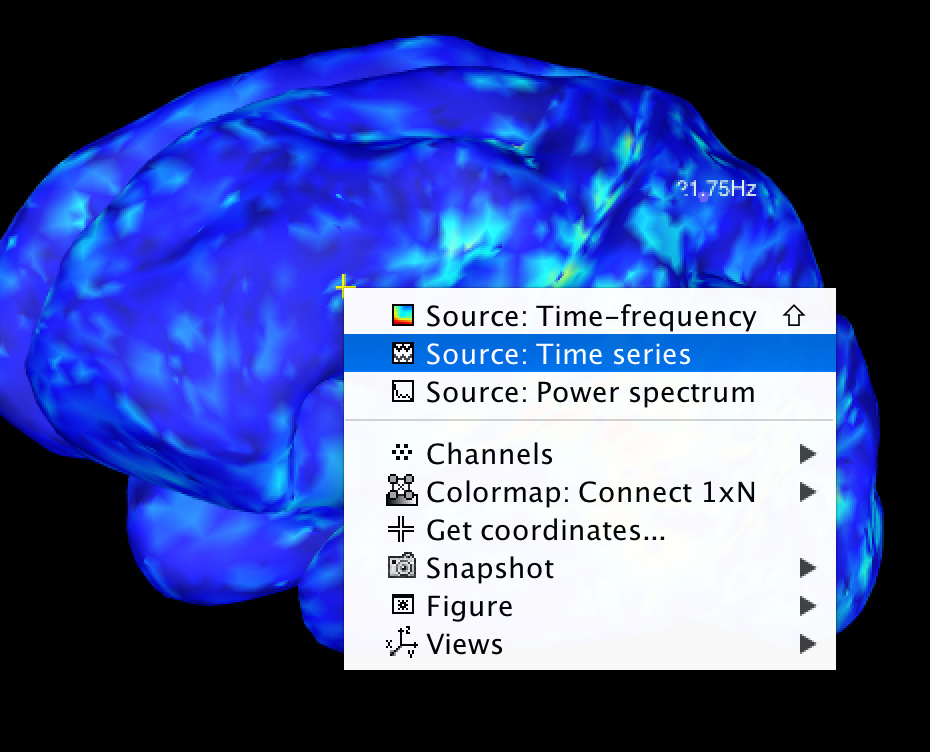
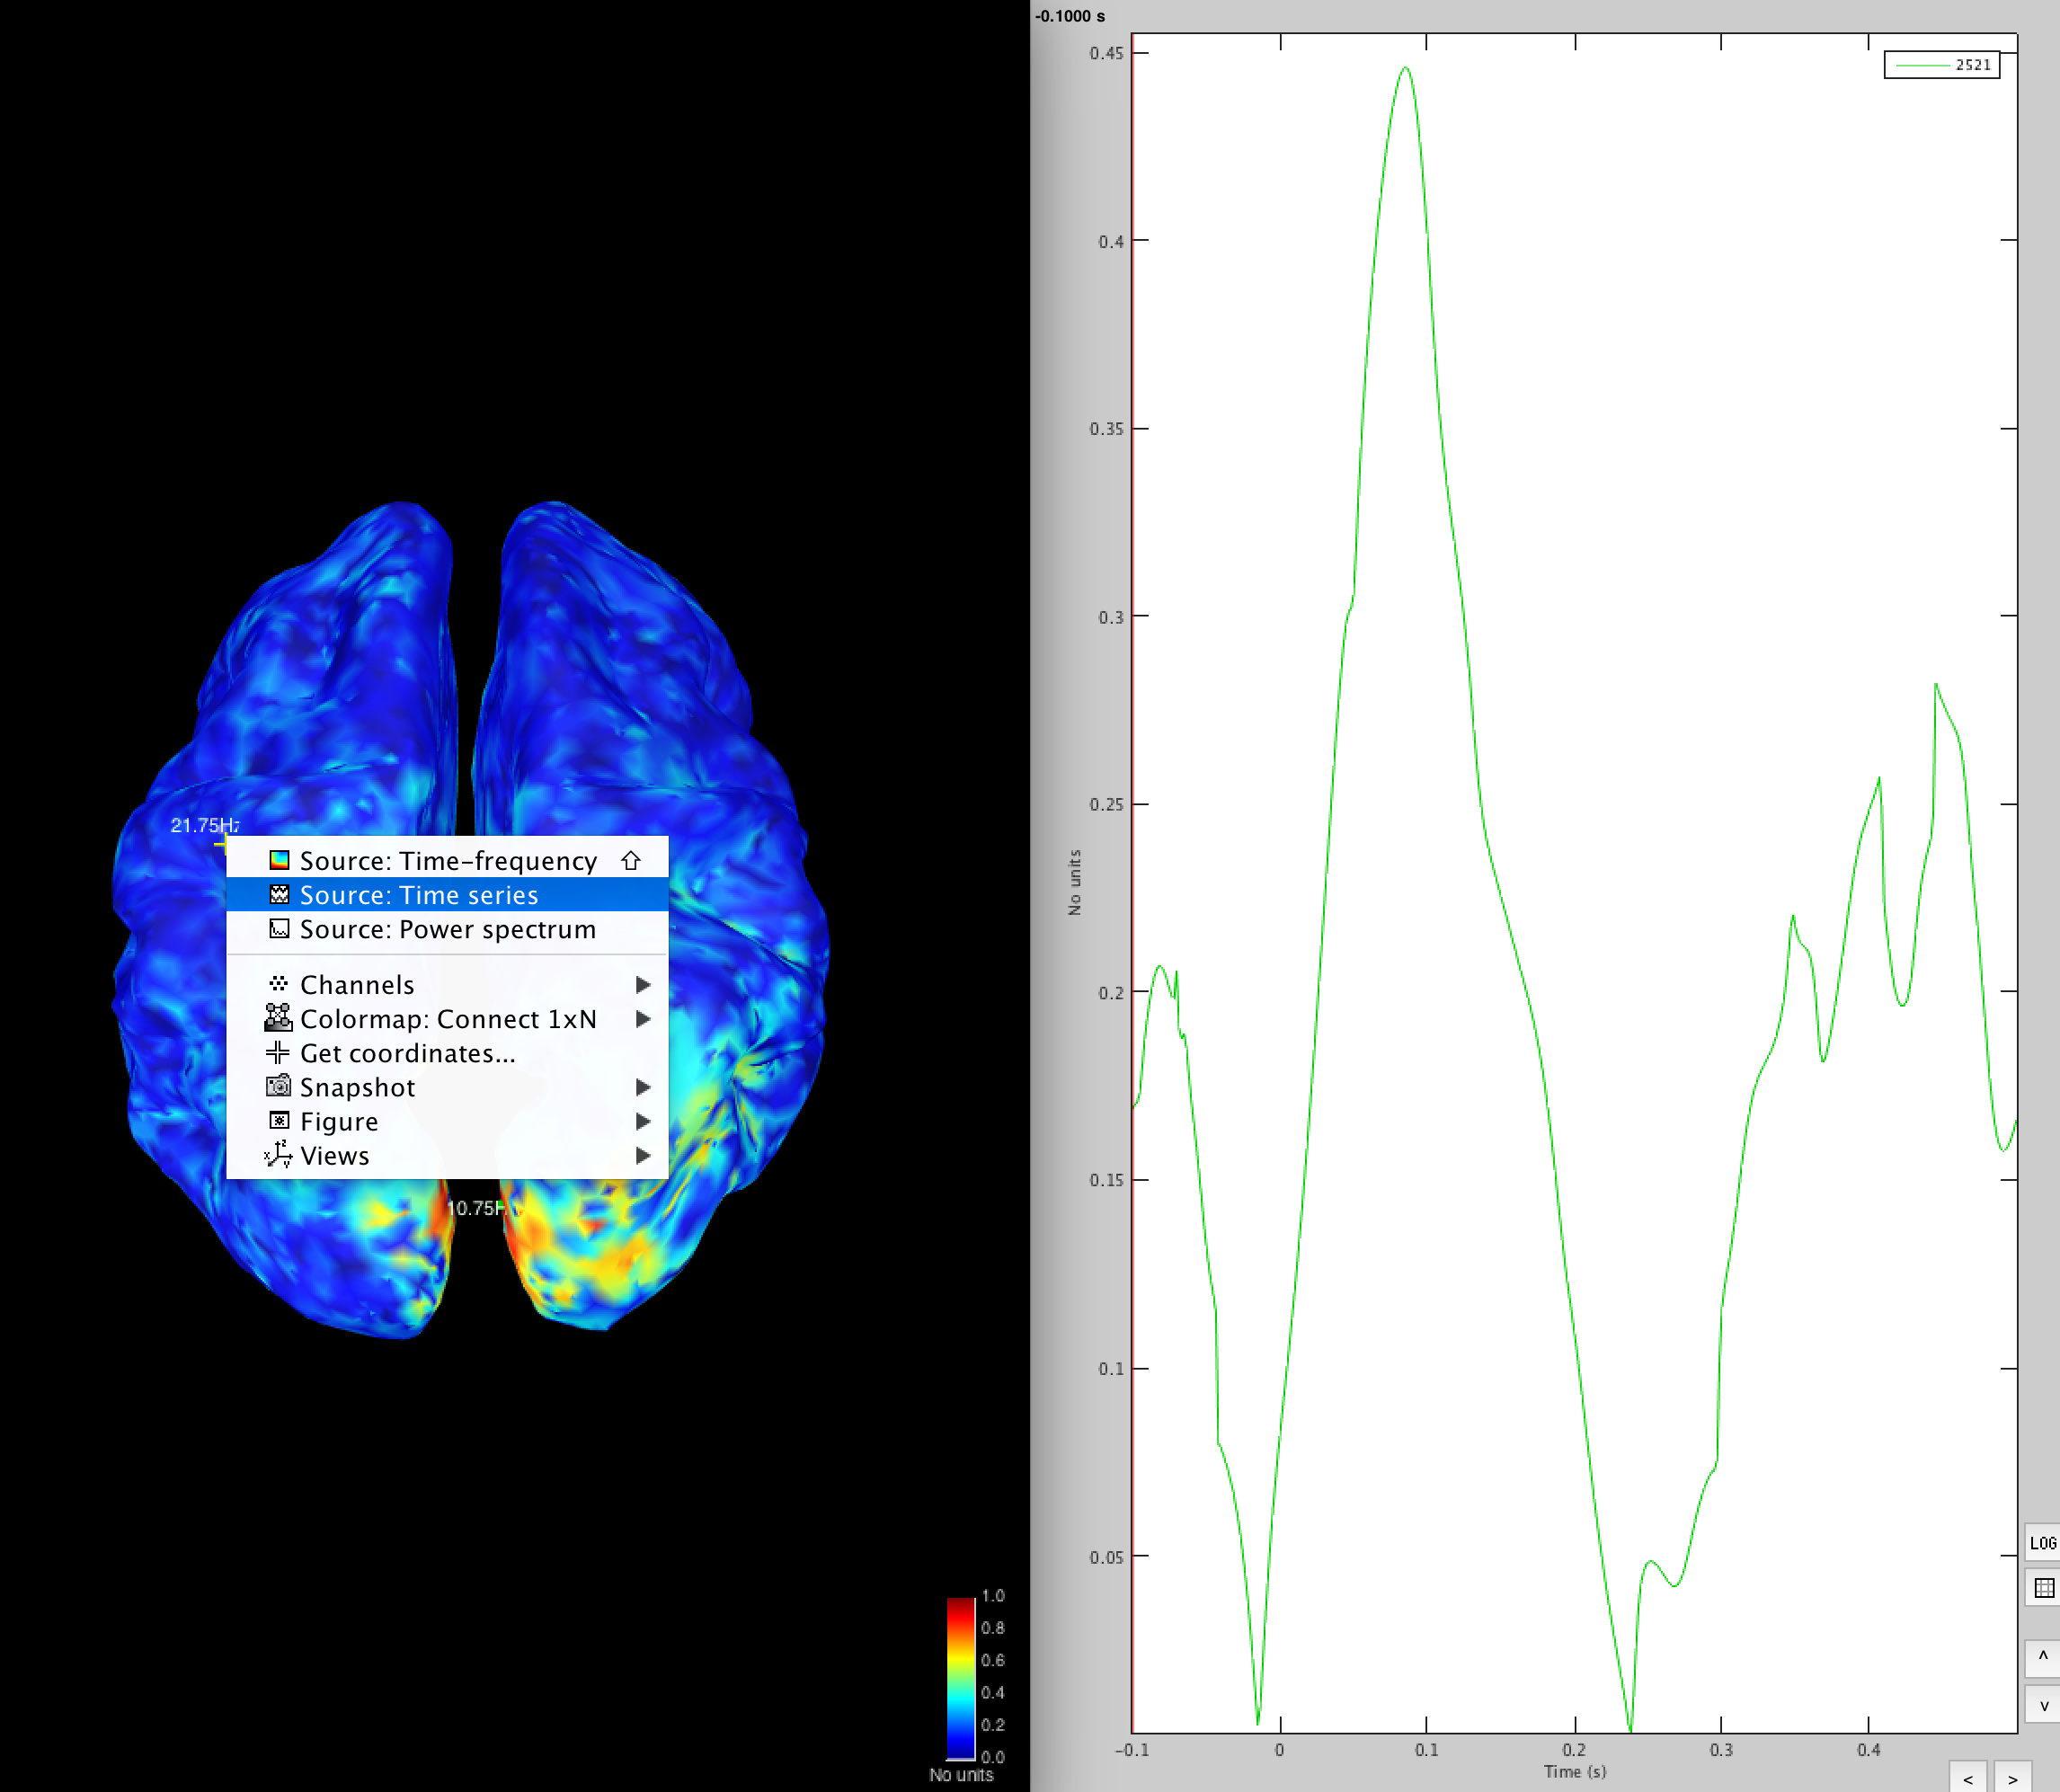
One way to display the PLV time series is by right clicking over a source of interest in the 3D brain view, and select Source: Time Series. See picture attached.
It will then open another figure, which will show the PLV time series at that location.
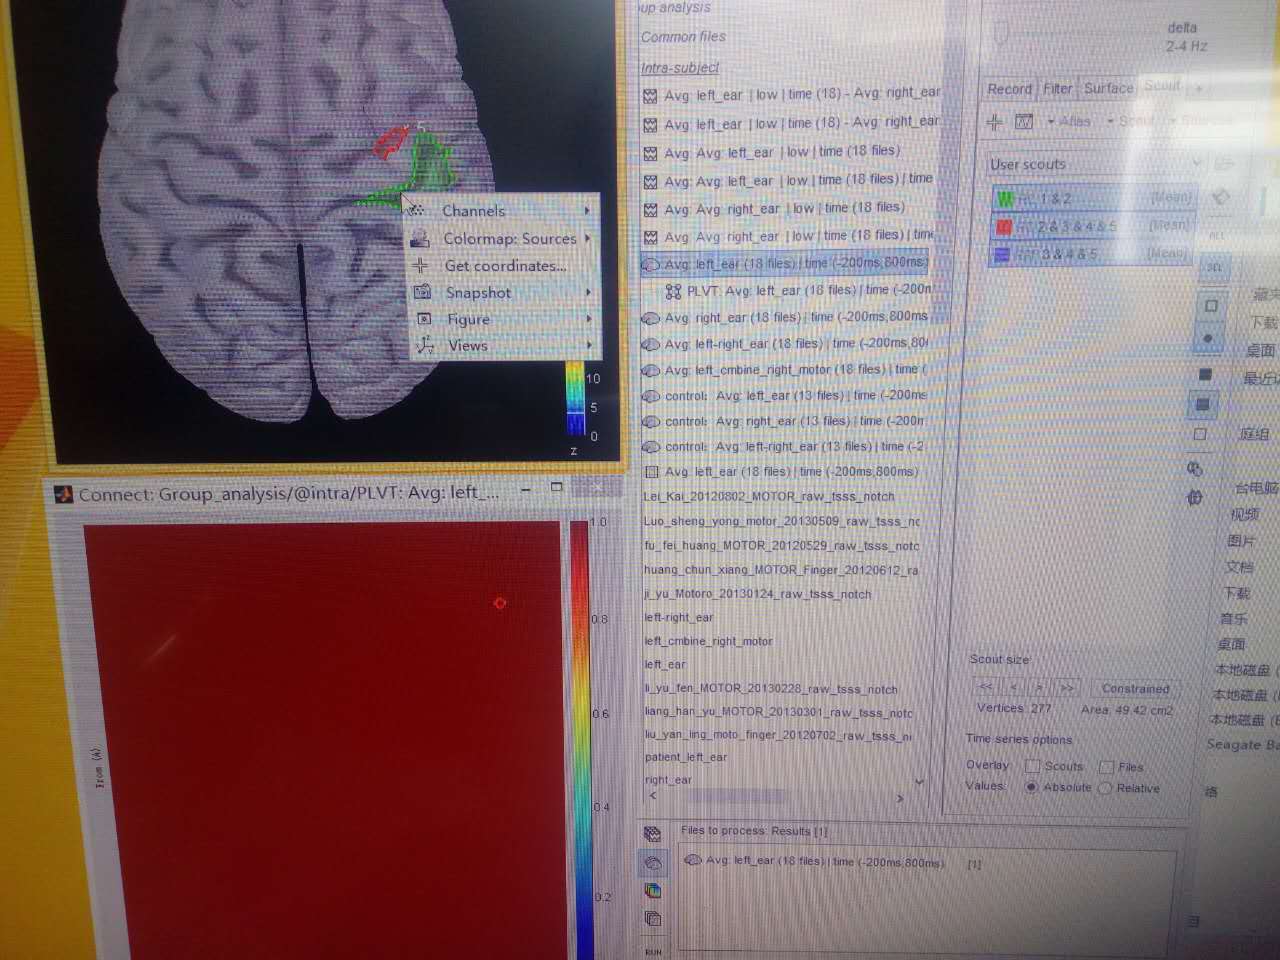
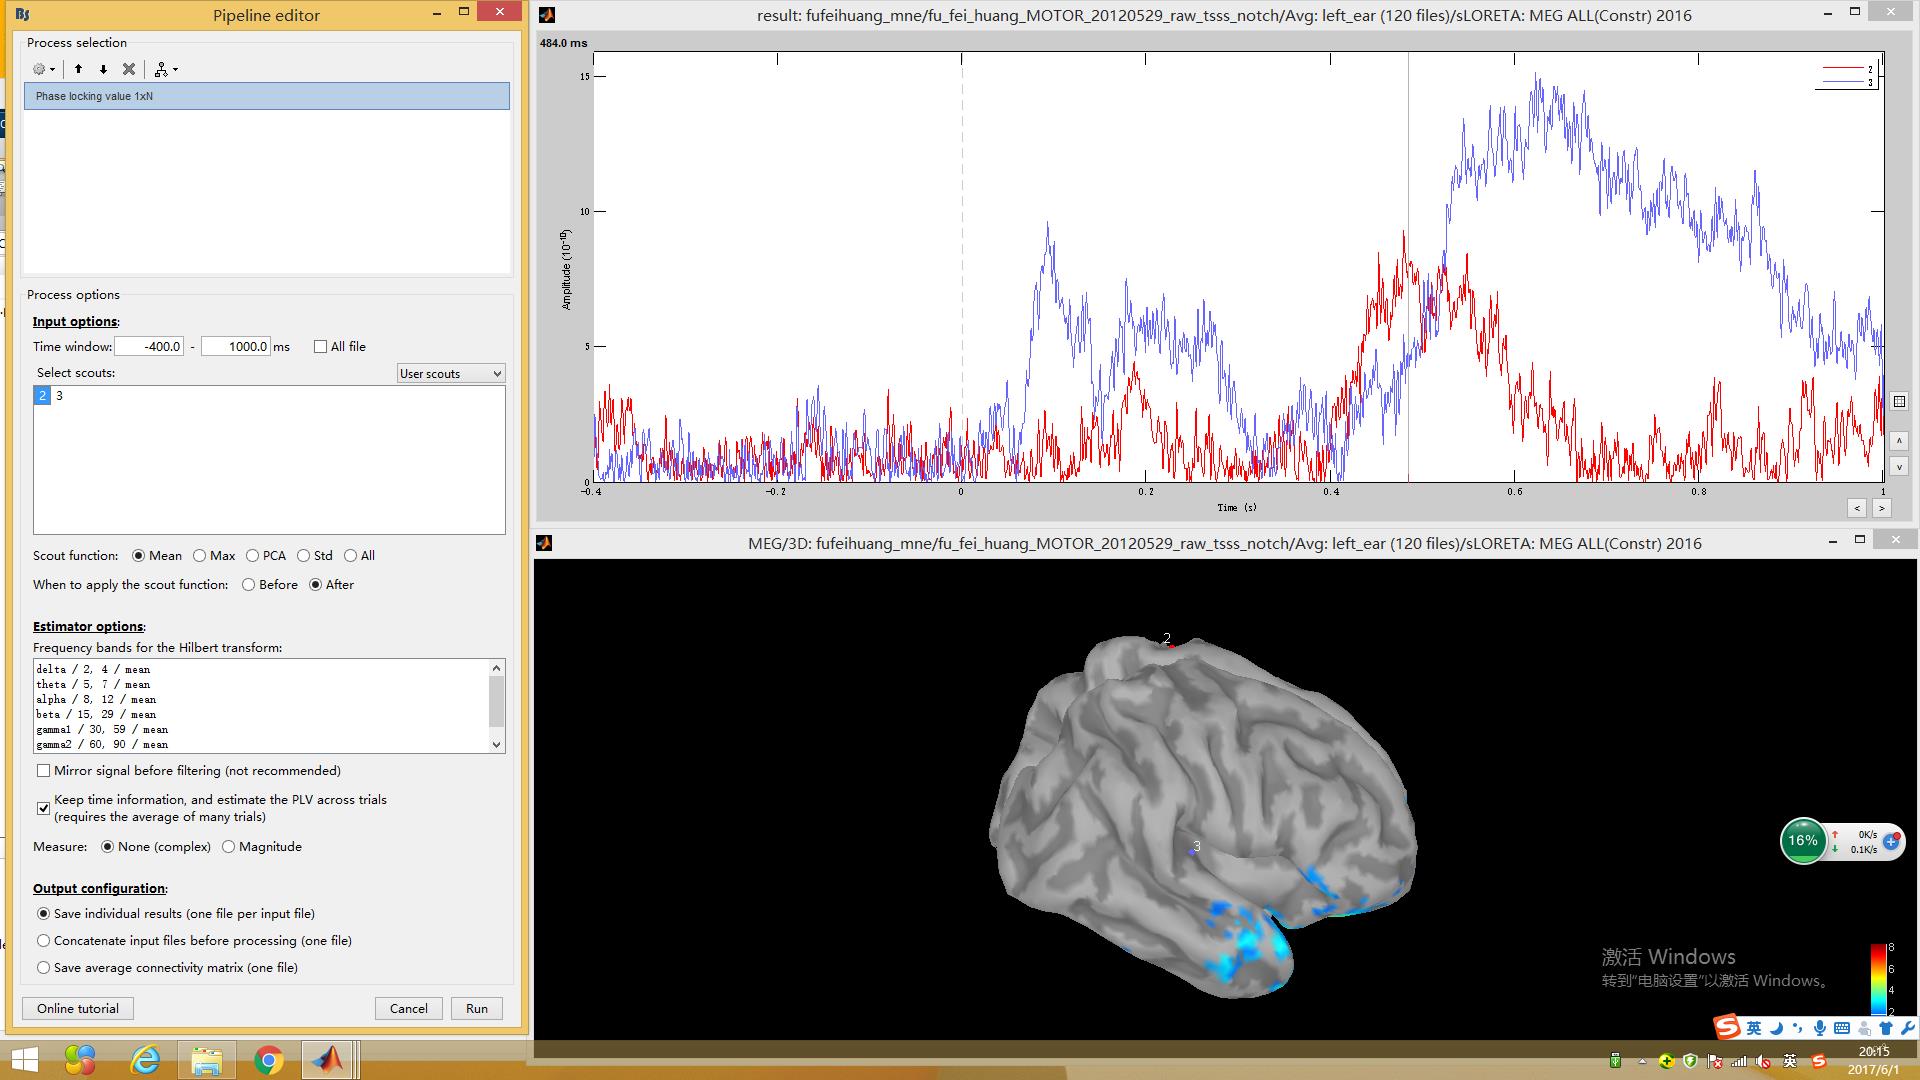
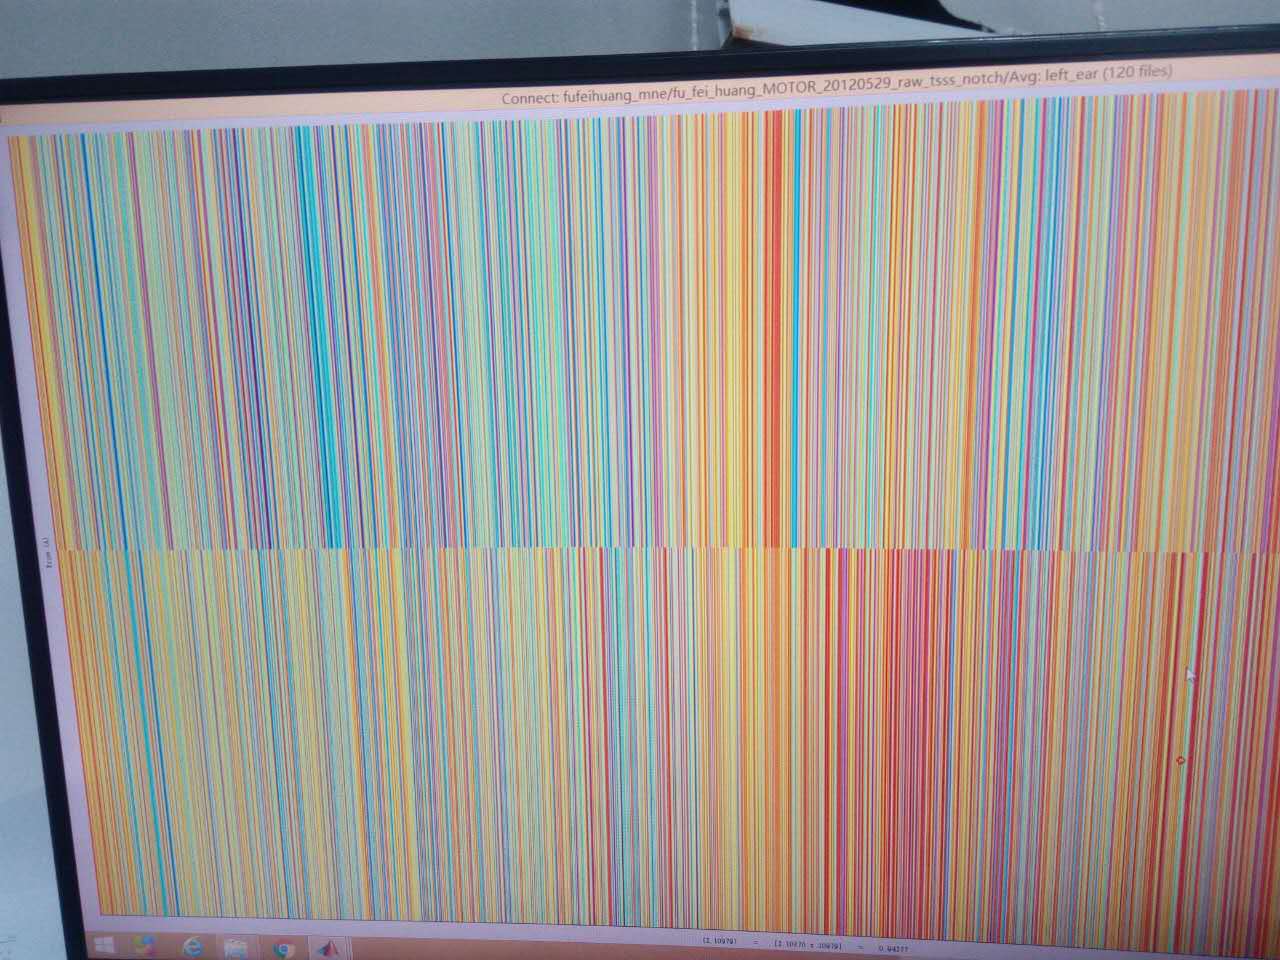
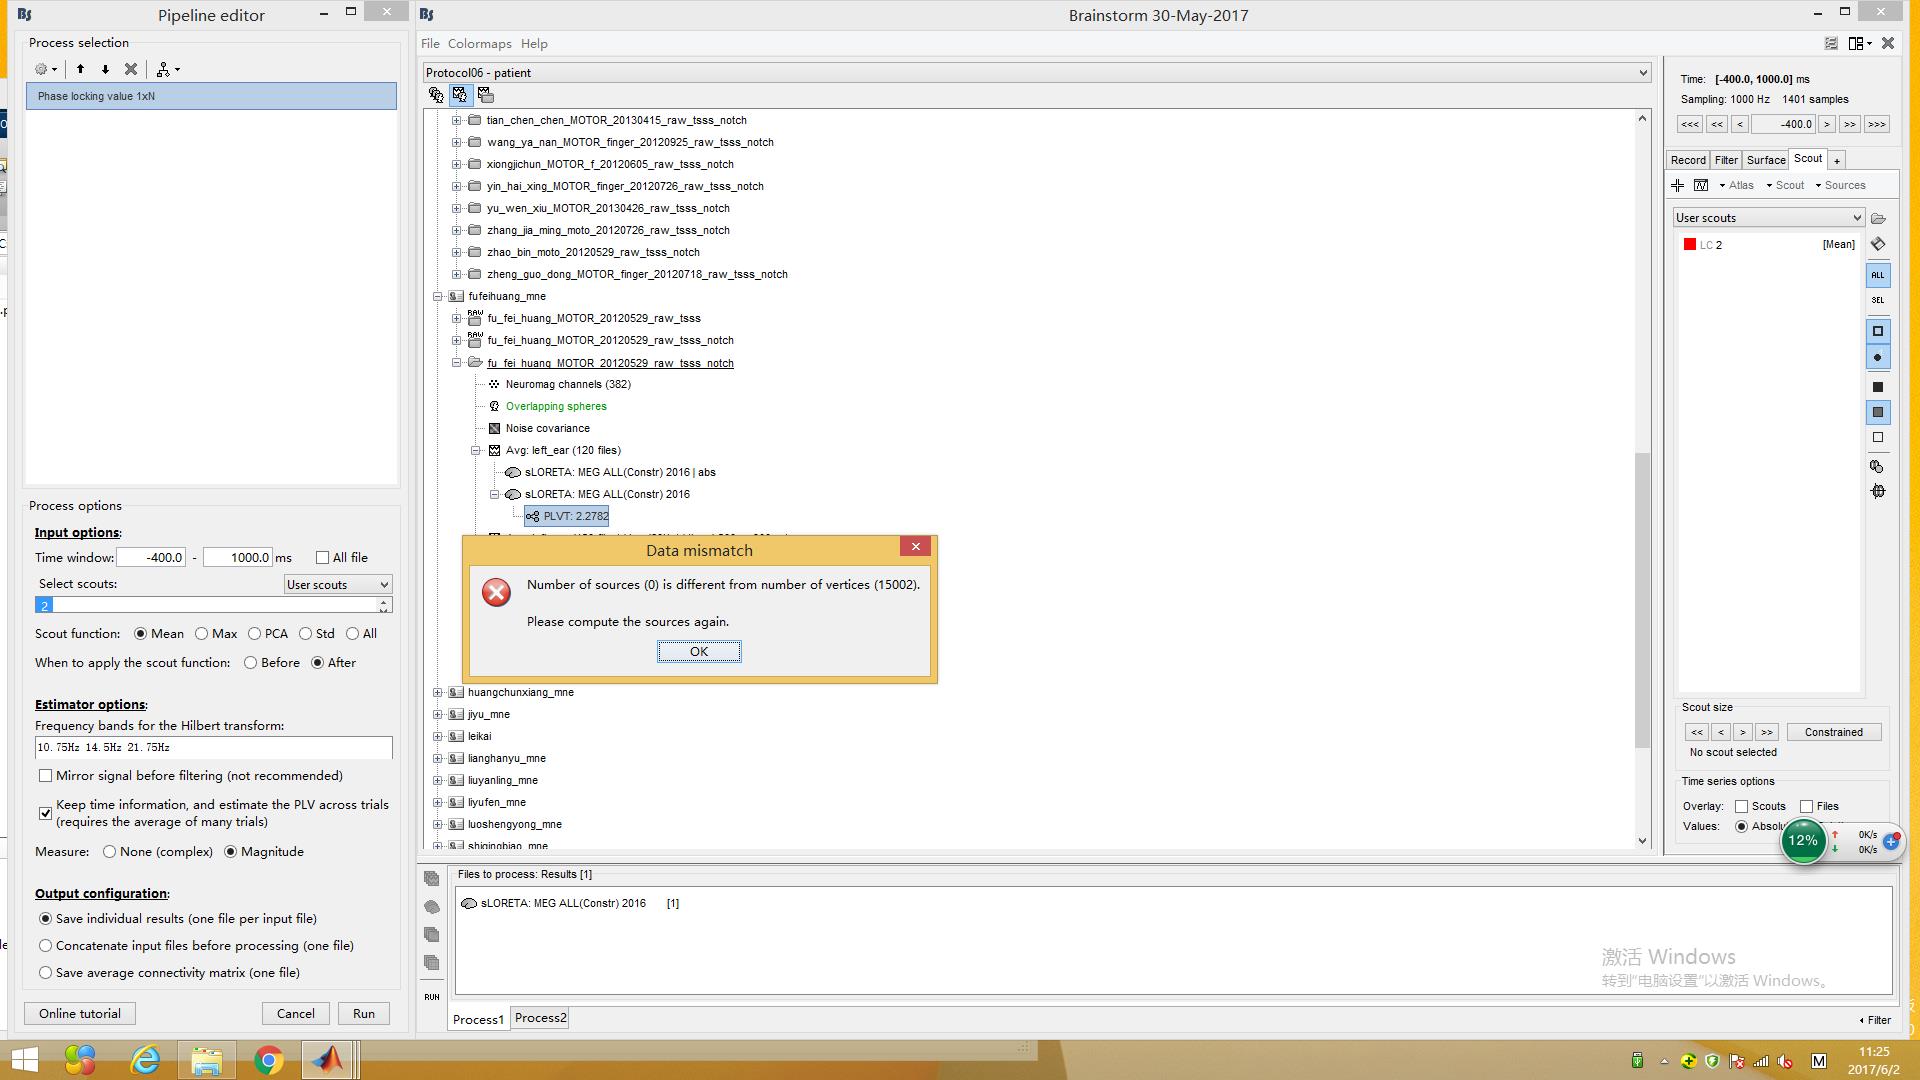
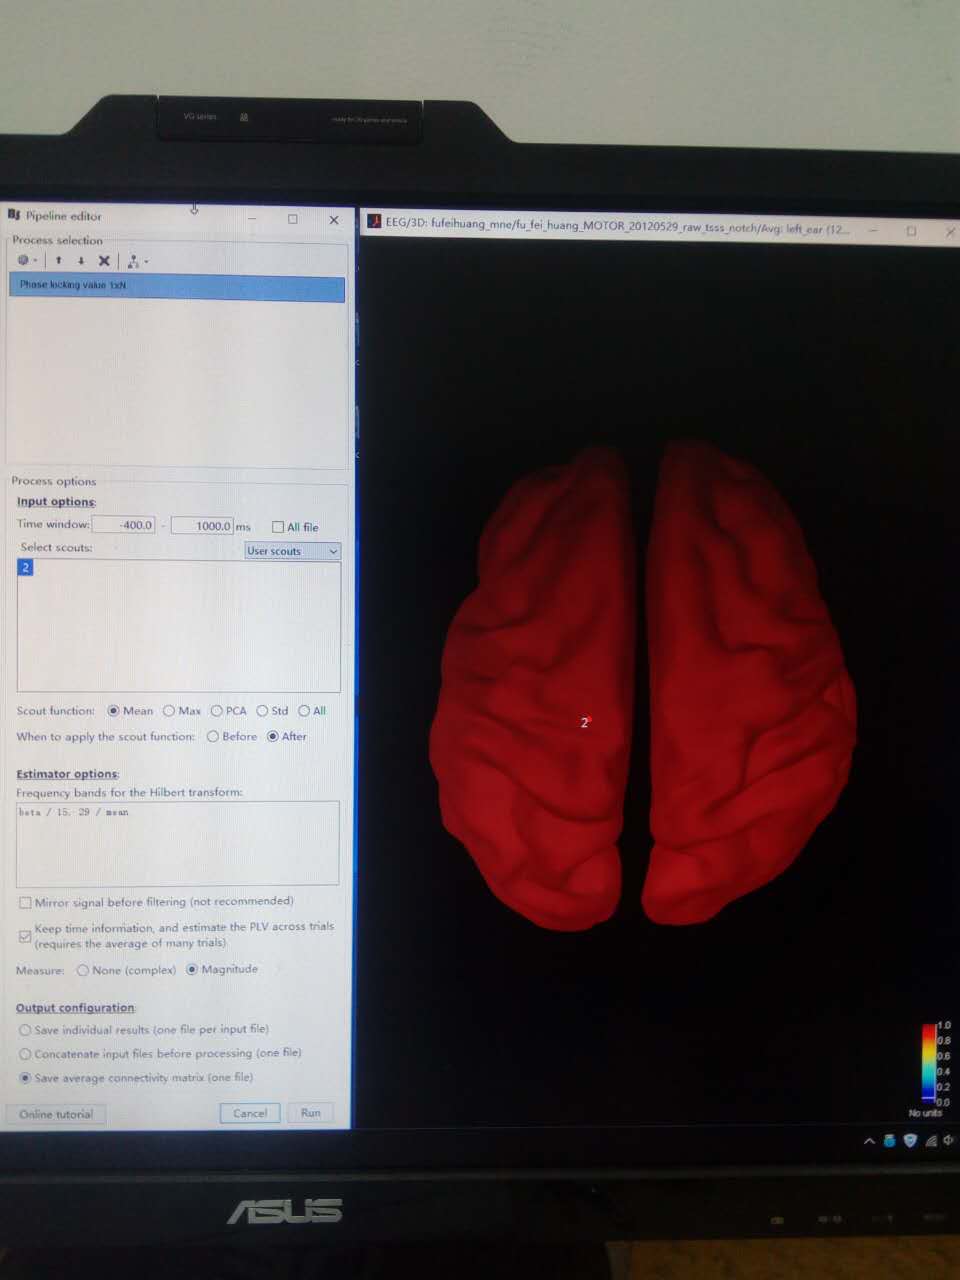
sorry to bother,i still don't figure out how you can get the item' time series',look at my right click menu,it seems totally different!And my plv time series file computed under the the source file,and shown in the way of image,it's the big red block at the left bottom,there are three scouts i choose .......
That’s because you have computed a NxN connectivity graph. the time-series display work with 1xN computations, which is what you were referring to in your original question I believe. Please try again using the 1xN PLV process, after selecting a region of interest as a seed to the PLV with the rest of the brain.
webwxgetmsgimg (1) (138.0 KB)
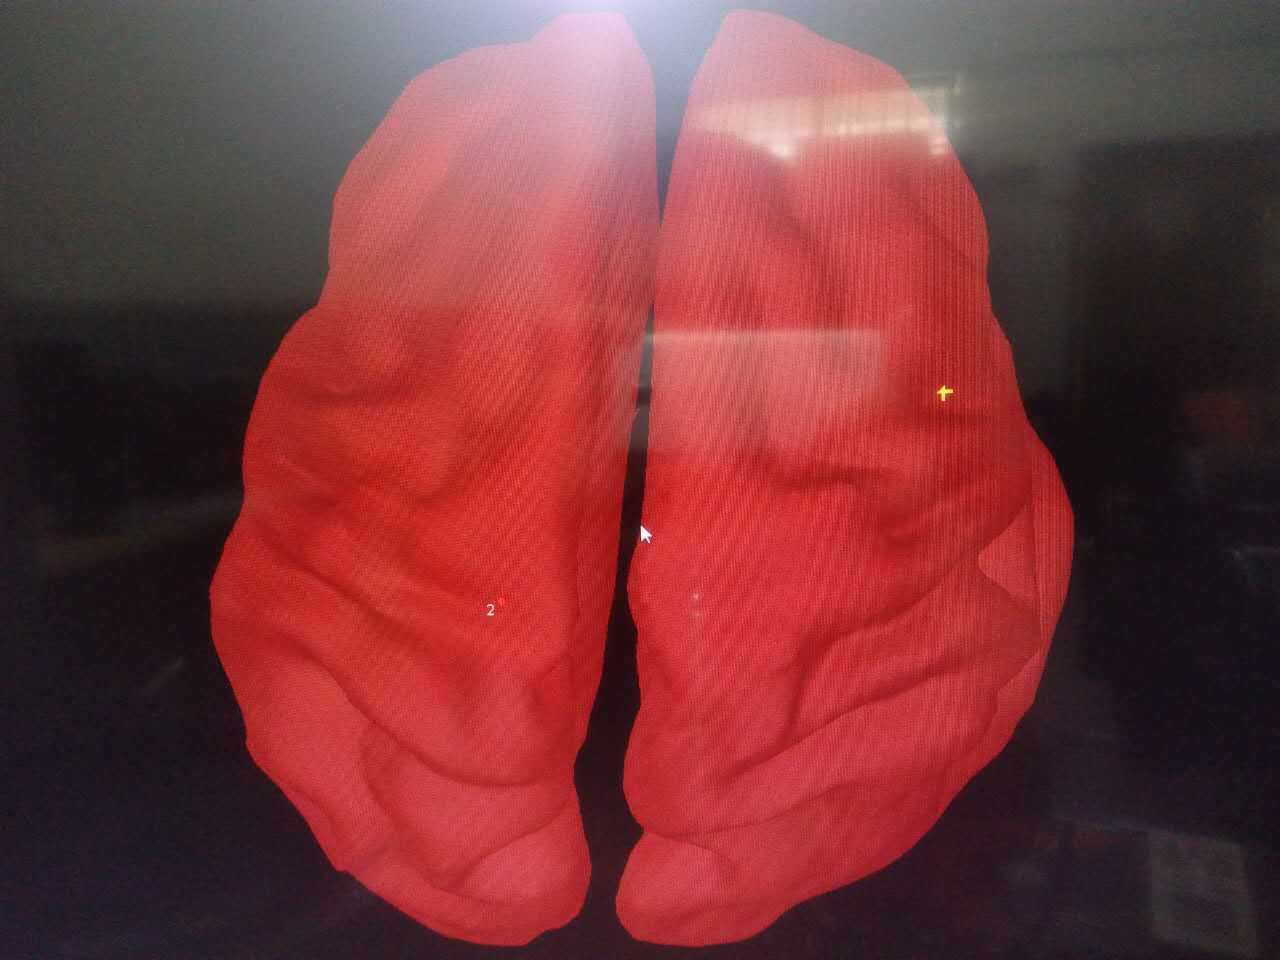
yeah,thank you,but i also tried to compute 1N plv just between the three scouts in order to avoid out of memory as the image show,the result was still like this.is it a must thing to comput the 1N plv between the roi and the whole brain ?if it is true,how can i avoid the case which is shown 'out of memory'.
Compute the 1xN PLV by selecting only one scout from the list available in the process GUI. This will compute the PLV between that scout region and the rest of the brain. To get this tested, please use a scout that contains only one vertex, not a broader region, and let me know how it looks.
WOW! it's magic! thank you! however,the result is still like what i said before,the whole brain is red,and when i choose another vertex and look at time-series plv.the result is aways one.apparently,it can't be like that!......
OK. Now you need to verify your data.
Can you display two arbitrary scout time series from the source map (before PLV), please? Also, please take a screenshot of your PLV calculation settings.
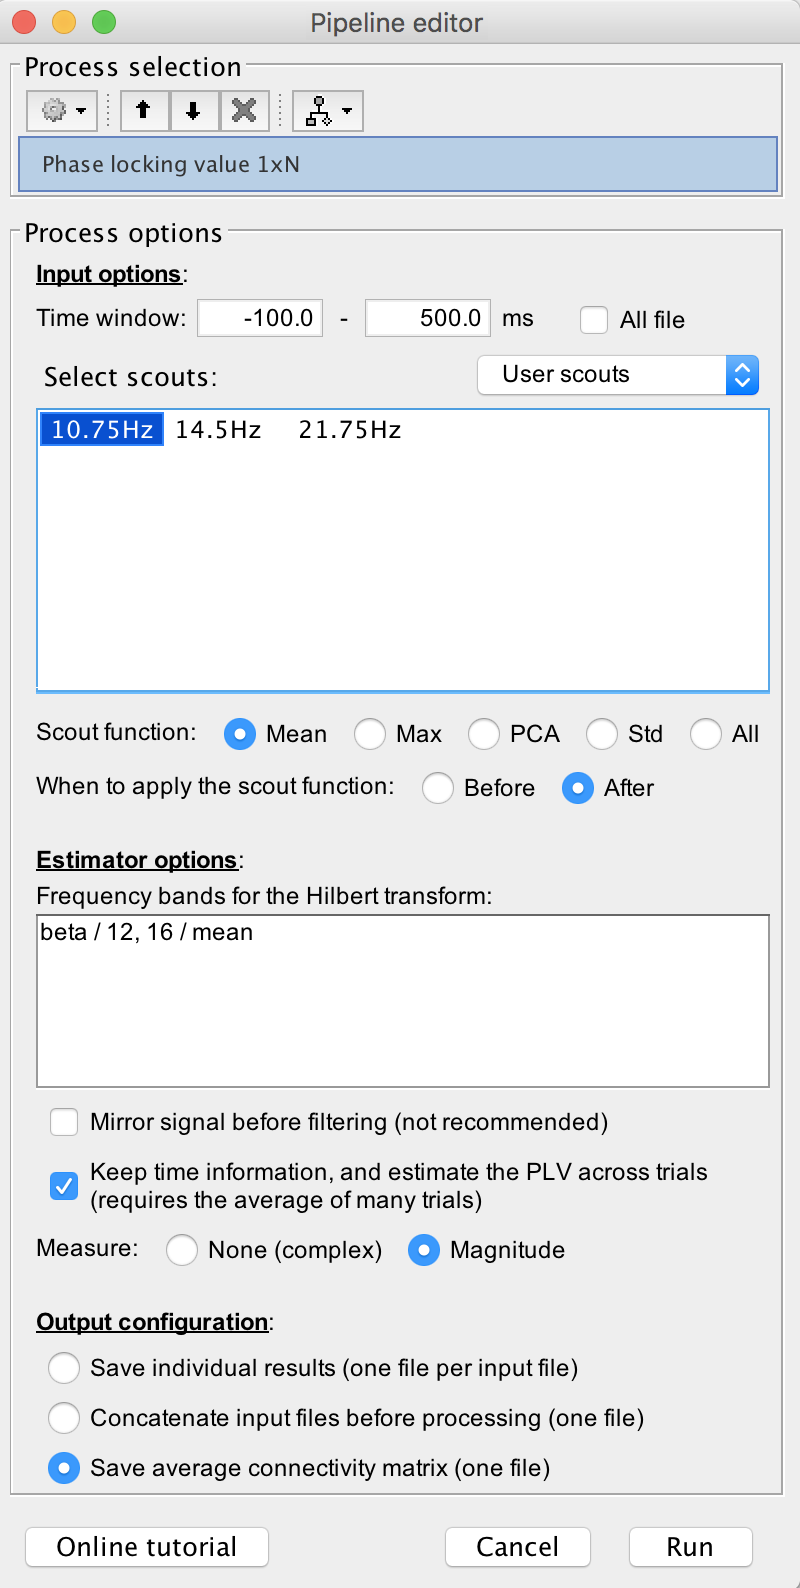
Make sure also you compute this PLV from multiple trials (39 in my example here). If you use only one or few trials, the PLV estimator produces meaningless results close to 1 indeed.
thank you for your patience!I did as your instructions,but every time i open plvTdata,it would give a error message which is shown in the screenshot.And my source was computed from the average of 120 trials,you can also see this in the screenshot.
Please reproduce exactly the options selected in the PLV GUI screen capture of my message above. The frequency band (estimator options) need to be defined with a certain syntax (in my example: beta / 12, 16 / mean). The name of my scouts are confusing because they’re labelled with frequency values. In your case, it is scout #2 apparently.
Also, make sure the last button at the bottom is checked: Save average connectivity matrix (one file).
this is my processing procedure:
1.remove artifact
2.remove line noise
3.epoch
4.average by conditions
5.compute noise matrix,head model and finally compute source from the average
does there exist any step possiblely resulting in plv computing result like this?