Dear Brainstorm team,
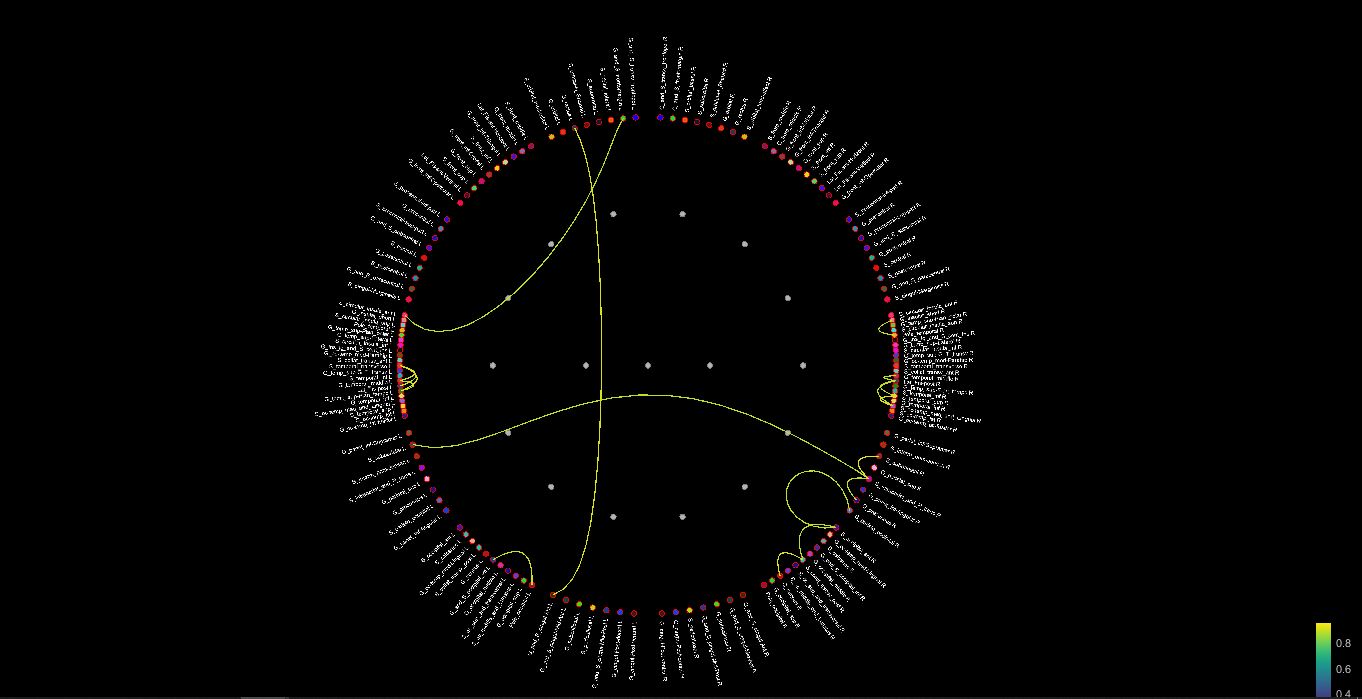
For some demonstration purposes, I need to save the graph according to the connectivity measures. For other figures in the brainstorm you only need to right click and save as image. But this feature is not available for the graph image achieved by the connectivity measures..
Is there any to save this image? Since there are so many labels in the graph, snapshots make a very bad quality images.
Hi,
If you use the matlab environment and you have that figure open you can use : saveas(gcf,'connectivity','epsc') which saves your currently open figure in a .eps file which is a vector format and may be better to work with .
Kind regards,
Steven
1 Like
Sadly, Steven's trick won't work for this specific figure because this is actually a Java figure, not a Matlab figure. For this very reason, we have very limited support for this figure and we have wanted to replace it with something better for a long time now, it's on our long to-do list.
I am afraid I don't have a better suggestion than the following: try to find a monitor with the highest resolution possible, and make the figure window as big as possible when taking the screenshot (you can zoom in and out with the mouse wheel).
I know this is not ideal at all, I apologize for the inconvenience.
Martin
2 Likes
Thank you for your response.