Sure, sorry!
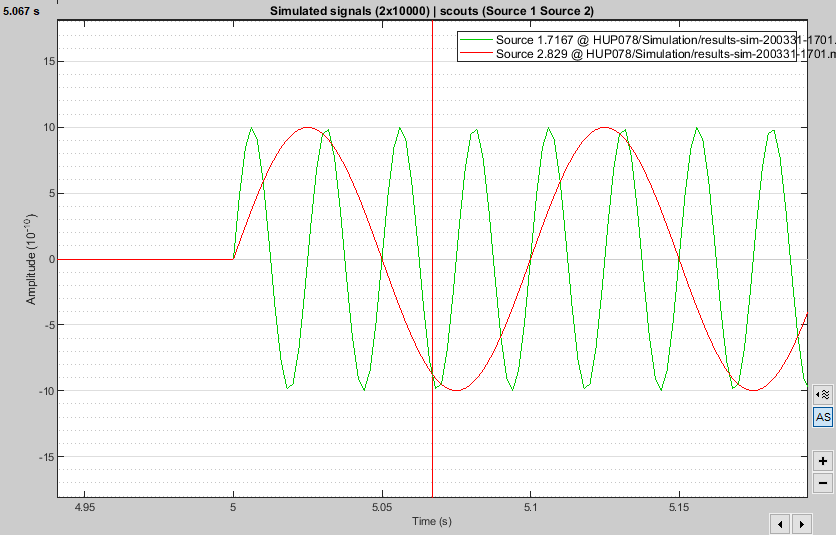
So, the signals that I simulated on the scouts are these (10Hz and 40Hz, same amplitude):
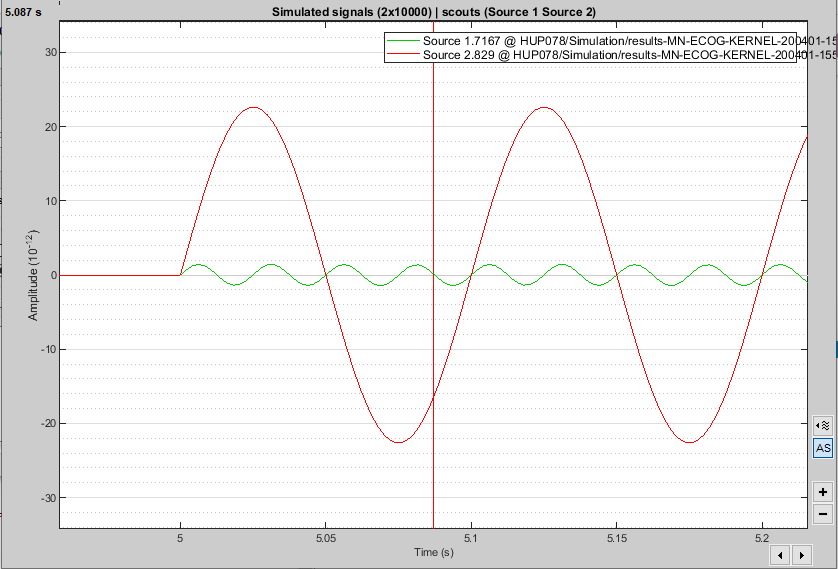
Then, I simulate the recordings in the EEG using those scouts and try to reconstruct the source using a MNE method with an identity matrix for noise covariance, without normalization (current density map), and constrained source model. From the reconstruction I extract the time series of the scouts (Sources file - Run process - Extract - Scouts time series), with the following options:
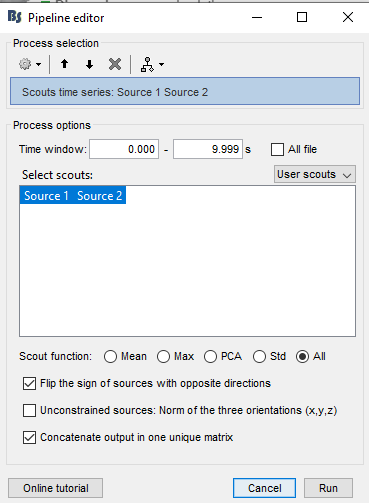
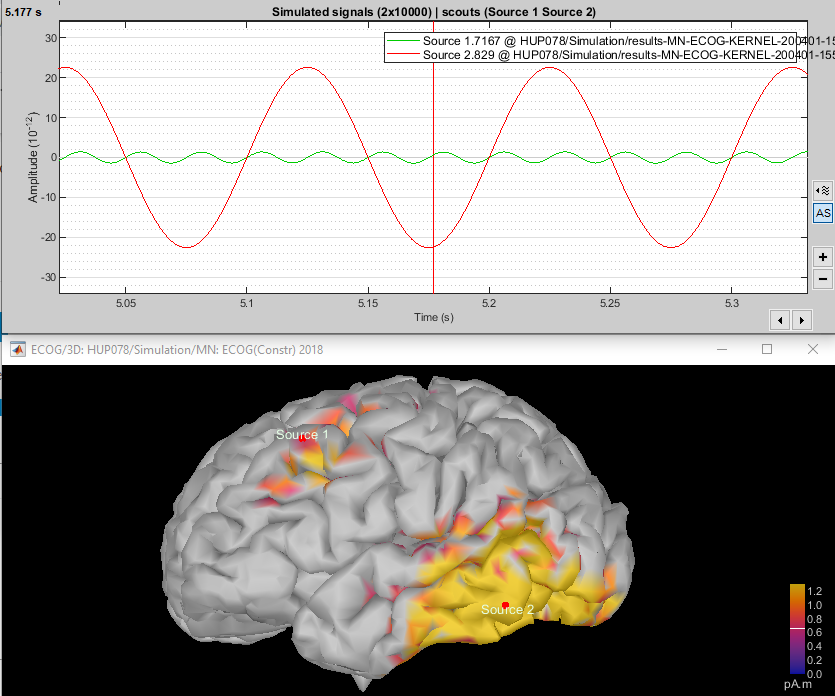
And I obtains these signals (a 10Hz and 40Hz, but with different amplitudes):
There problem with this is that when you plot the cortical activations, depending on the colormap threshold the Source 1 is not visible (the automatic threshold is to high) or the source 2 is not focused on the source (spread because custom threshold for source 1 is to low for source 2). Here is an example of both cases:
(Global max as colormap threshold, no activity in source 1)
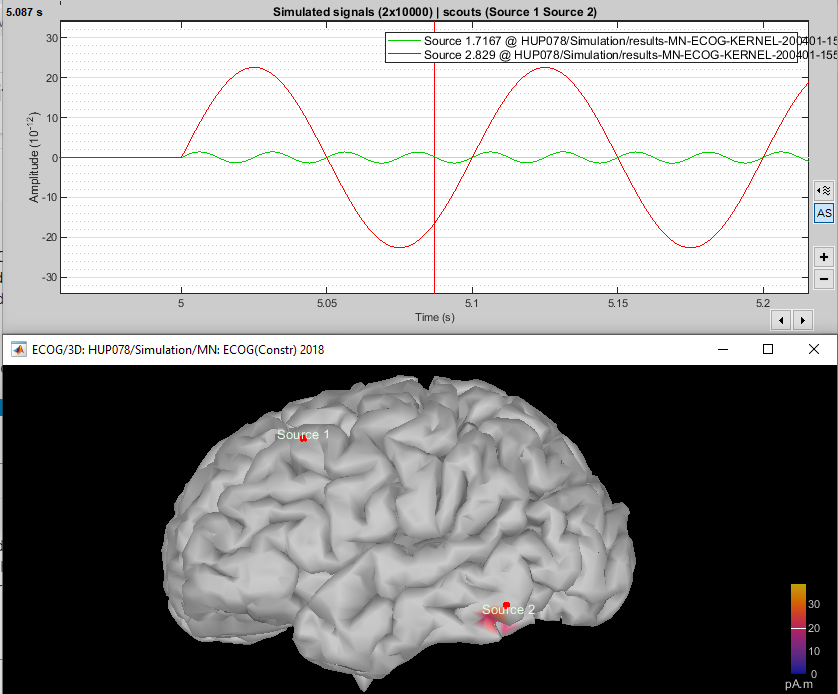
(Source 1 max as colormap threshold, the activity in source 2 is too spread)
I don't know if there's any kind of amplitude compensation for higher frequencies or something like that?