Hi,
as the title mentioned, i want to simulate some EEG signals to verify my source reconstruction algorithm.i have followed the tutorials in this forum to simulate EEG signals :
But i find if i have 2 different generated signals(such as Sin and Cos curves),and use the options 'simulate the recordings from scouts', it will just generate two different simulate EEG scalp signals corresponding to different generated signals.
All i want to do is to apply different generated signals in different scouts to simulate one EEG scalp model and its signals.In other word, It means i want to make different scouts have different source signals and use this source model to simulate a EEG scalp model.
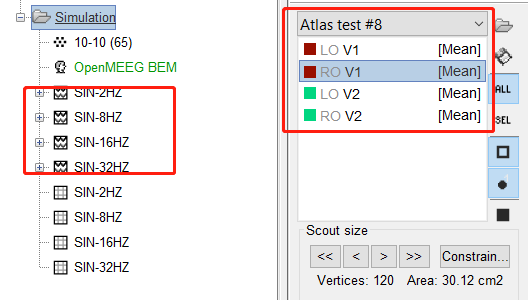
like the figure i posted as following, i plan to make V1 area have 2Hz-Sin signal ,and V2 area have 8Hz etc.
Thanks a lot in advance!!
What you need to do is to simulate initially one file containing all 4 signals, using the process "Simulate generic signals" with a Data matrix with 4 rows (Data(1,:)=...; Data(2,:)=...; Data(3,:)=...; Data(4,:)=...)
Then the process "Simulate recordings from scouts" should be able to match the 4 signals with the 4 scouts (you need to be careful with the order of the signals), and generate only one source file and one recordings file.
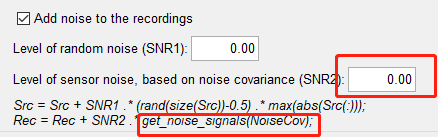
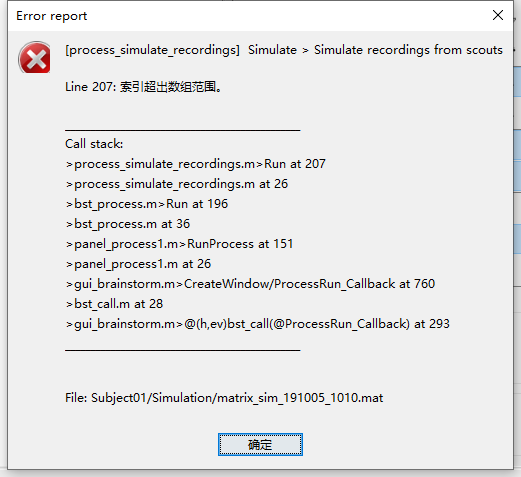
However, i found some problem with the 'add noise option' now :
For the further step, i want to add some 'SNR2' noise into my simulated signals while the GUI noticed there is some bugs: [the index is out of range of array]
the reason I guess is that maybe i need a [noise covariance matrix]?
Because I am fresh user for brainstorm ,i found few instructions about what i want even though i have read and searched some key word in the tutorial and forum.So there is my questions:
1.Is there some documentation of details of 'add noise to the recordings' option?
2.How should i do to add 'SNR2' into my simulated signals?
3.Is the measurement unis of noise(both SNR1 and SNR2) 'dB'?
the relevant images are as following:
Thanks a lot in advance!!
Yes, you need a noise covariance matrix in the first place. For learning about this, you need to follow the introduction tutorials until #21: https://neuroimage.usc.edu/brainstorm/Tutorials
The units for SNR1 and SNR2 are the same as the simulated signals.
Currently I'm trying to test some procedures on the inverse solution performing some simulations. For this, I want to create (as stated in this forum) 2 different signals in 2 different scouts. I completed the procedure as you suggested:
I have 2 scouts named Source1 and Source2
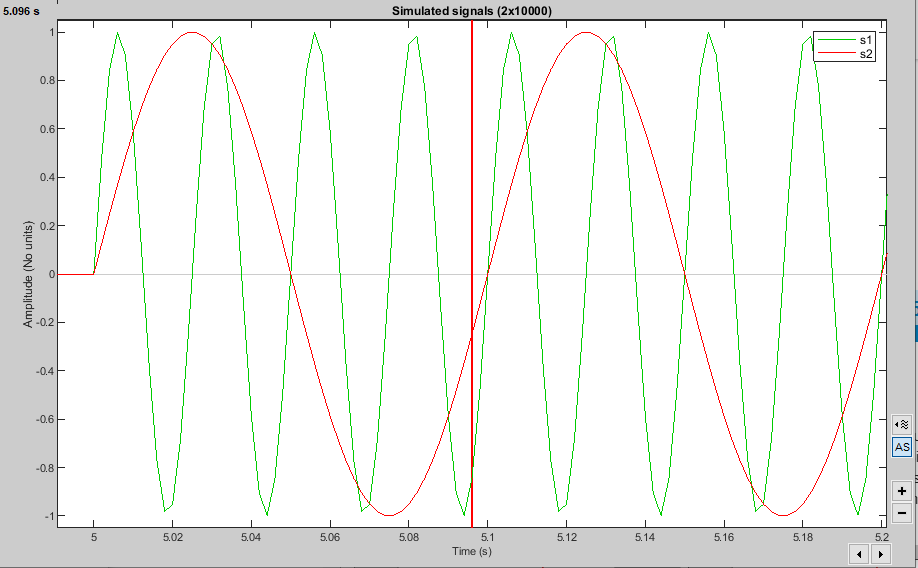
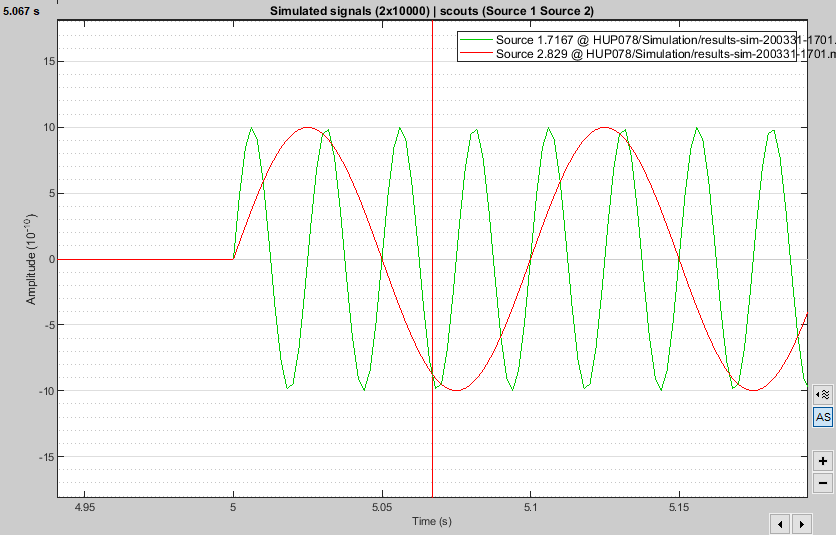
I simulated the generic signals as a Data matrix with 2 rows, one 10Hz sin and one 40Hz sin
f1 = 40; f2 = 10;
i =5000:10000;
Data(1,i) = sin(f1 * 2 * pi * t(i));
Data(2,i) = sin(f2 * 2 * pi * t(i));
Simulated recordings from scouts selecting the 2 scouts.
I expected to have the 10Hz sin in one scout and the 40Hz sin in the other however, I think it is kind of mixing the signals and now I have a 20Hz sin in one and a combination of 20Hz and 40Hz in the other one Is there any way to have nice and smooth data in each one without combining them?
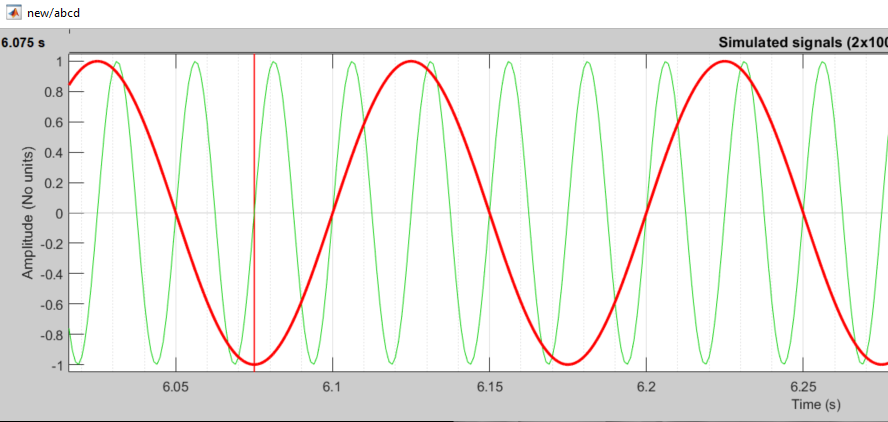
What is the sampling frequency you use for your data. Note that if it is close to 80, say 100. The data will not look that nice. With your code i'm able to get the following source signals.
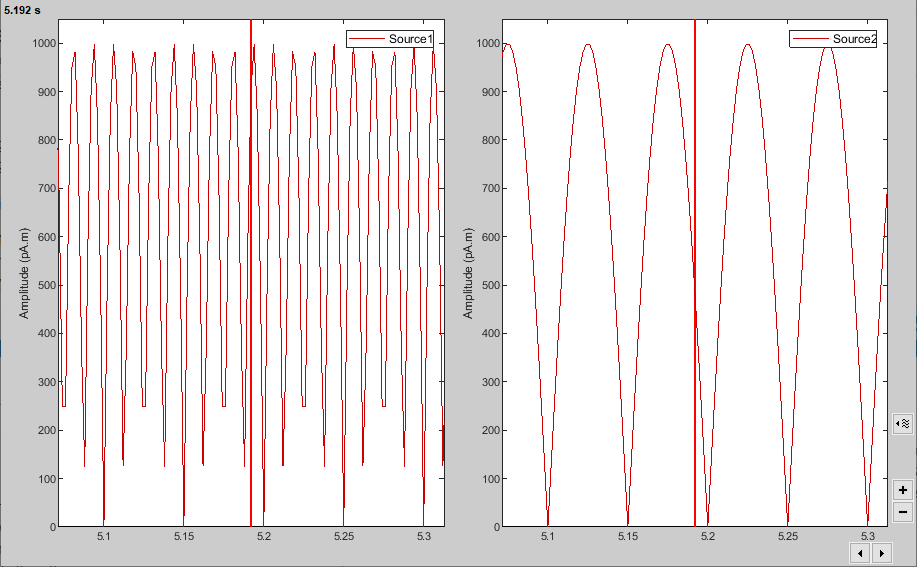
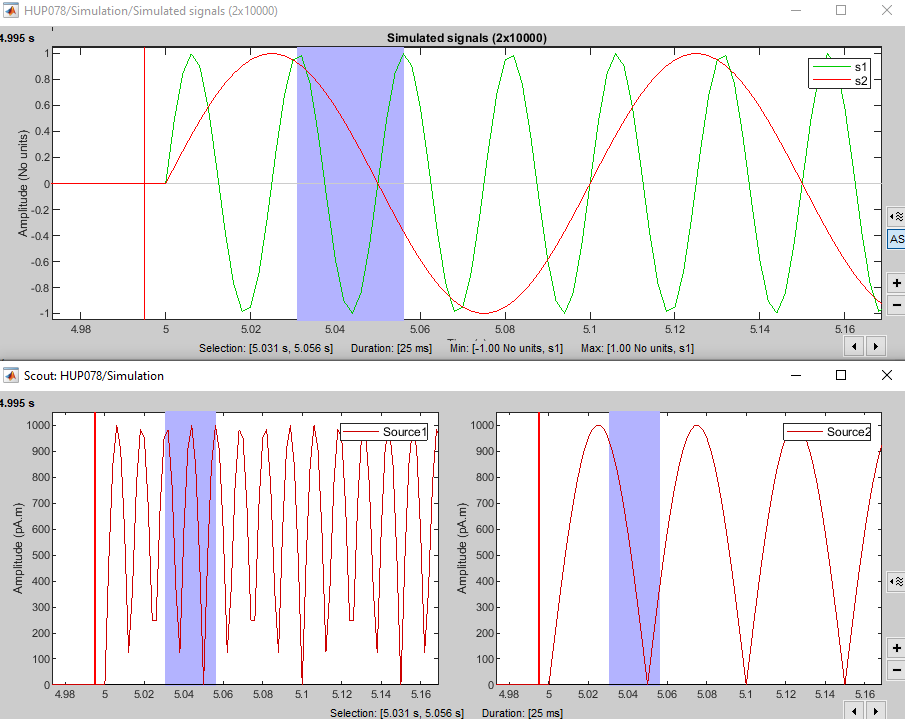
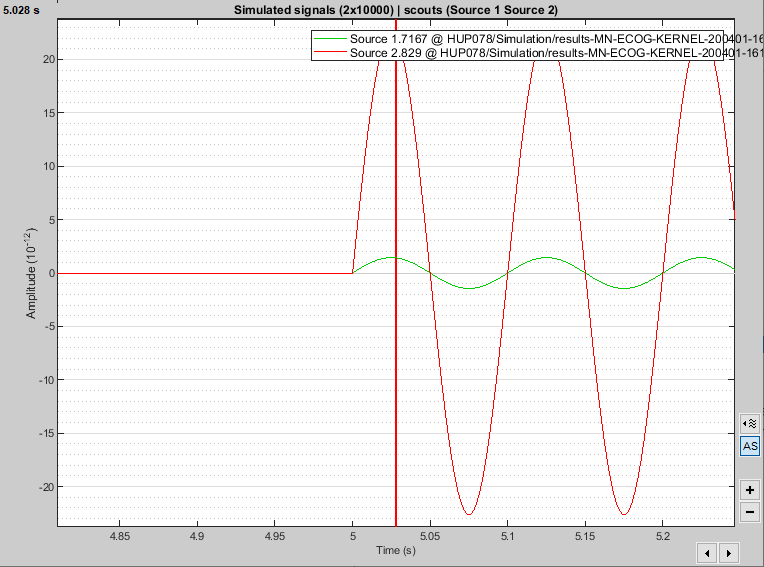
The problem is when I perform the simulation using "Simulate recordings from scouts" and then go to simulated file - Scouts time series. Those signals (still at the scouts - sources) are 20Hz one and a mix of 20HZ and 40Hz the other (image below)
I just realized that after the simulation form the scouts there is an inversion of the negative phases of the sin and everything is positive (maybe due to absolute signs at the sources?).
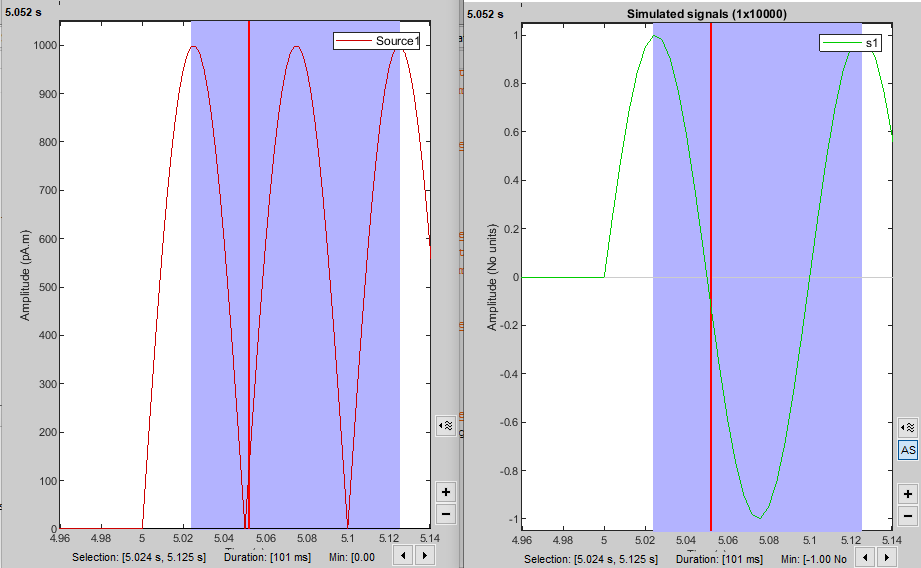
The right image is one 10Hz simulated signal and the left image is the simulated signal at the scout after the computing of the recordings. The selected period is one sin cycle in the original simulated signal (100ms, 10Hz).
Given this, with the 2 simulated signals, at 10Hz and 40Hz, after the computation of the recordings I think I'm seeing one source with 10Hz and the other with a mix of both 10Hz and 40Hz? I'm not sure about the mixing of the activities at source 1 since it seems that the signal is saturated at some points plus is not a smooth curve as the one in source 1. Any idea about this?
You could try to switch off the absolute value option when visualizing the signals (I checked and it looks like it is not directly possible, though it is a factor) . That is probably one of the factors that are playing a role now. I will check it in more detail later
@vzapata01 In the Scout tab, select "relative" instead of "average".
If you still have issues: please share your example.
Create a new subject with only one example (to keep it small). Right-click on the subject > File > Export subject, upload the zip file somewhere, and post the download link here.
Thank you very much for your answers! I tried extracting the values of the sources from the source file and now it looks fine. Probably was beacuase of the average of the absolute value.
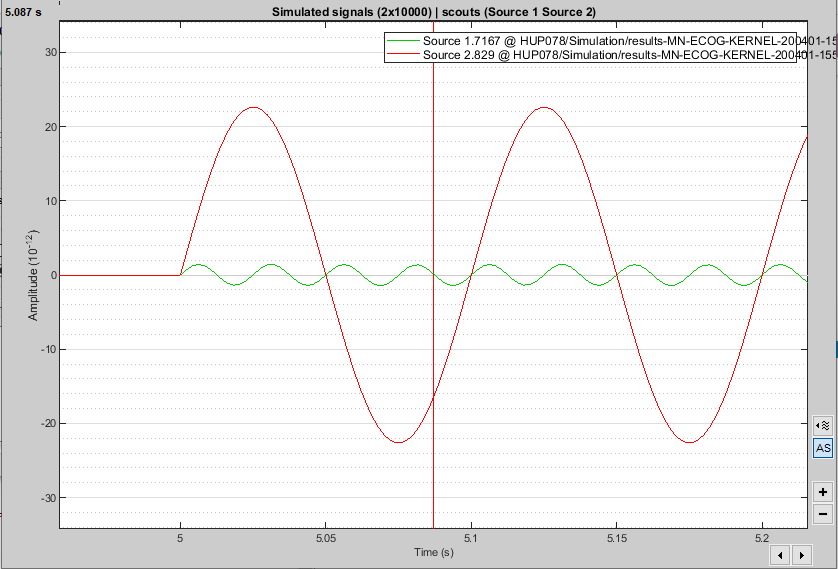
Now, I have another question regarding the inverse methods. I have the two sources as explained here (10Hz and 40Hz, same amplitude), and I simulated the EEG signals. I tried the inverse model using a Minimum Norm Estimate without normalization. It is able to recognize the two sources 10Hz and 40Hz but when I extract the time series of the sources the 40Hz activity´s amplitude is decreased a lot (around 3 magnitude orders) so the cortical activations are not well seen beacuse the difference in the thresholds. Do you know why this could be happening?
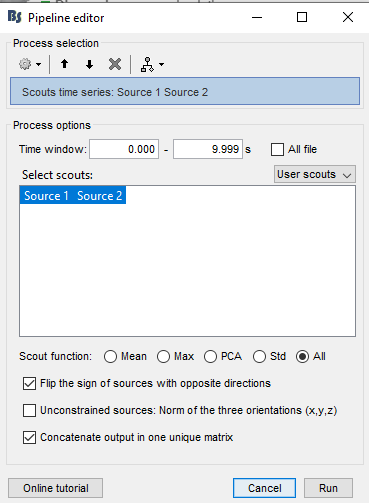
Then, I simulate the recordings in the EEG using those scouts and try to reconstruct the source using a MNE method with an identity matrix for noise covariance, without normalization (current density map), and constrained source model. From the reconstruction I extract the time series of the scouts (Sources file - Run process - Extract - Scouts time series), with the following options:
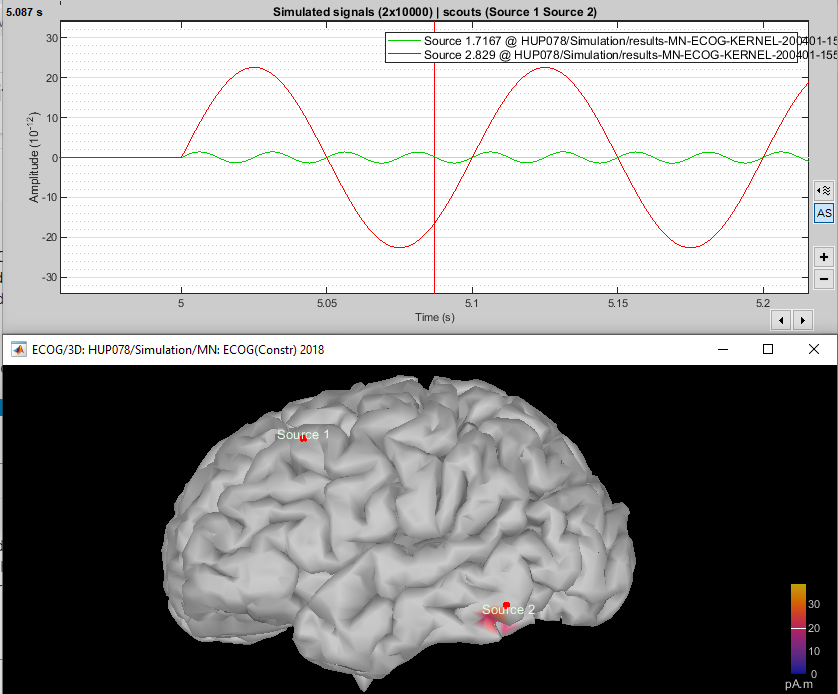
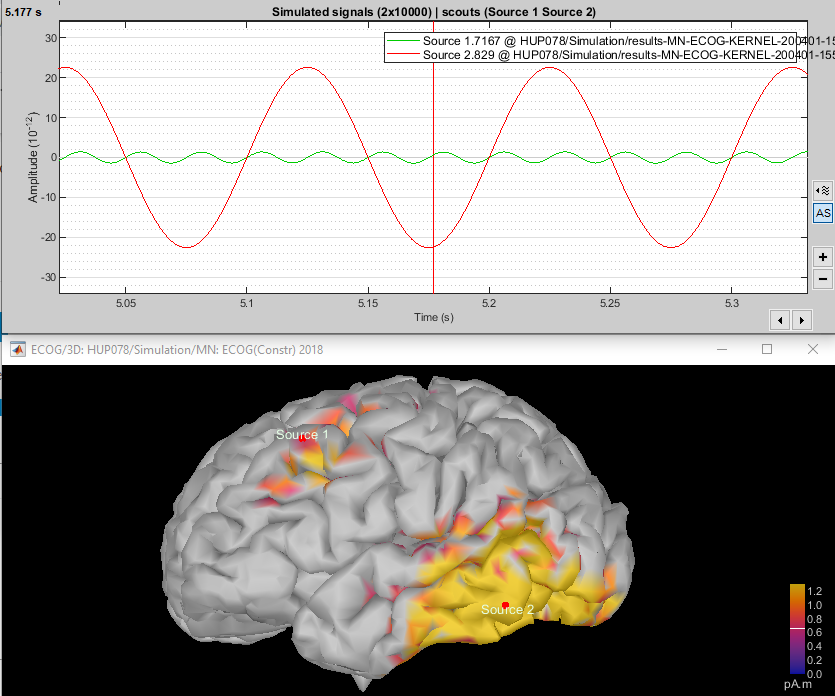
There problem with this is that when you plot the cortical activations, depending on the colormap threshold the Source 1 is not visible (the automatic threshold is to high) or the source 2 is not focused on the source (spread because custom threshold for source 1 is to low for source 2). Here is an example of both cases:
(Global max as colormap threshold, no activity in source 1)
Update. I just tried the same procedure but with two identical sources (10Hz, same amplitude sin in each source), and the reconstruction is biased again for the amplitude of the second source (image below)
Different source orientations and depth have different sensitivities to EEG.
Not all the regions of the cortex are visible uniformly in EEG.
Read some background literature in electromagnetic source modeling if these concepts are not familiar to you.
Things you can do to understand better what is going on in an experimental way:
Use larger scouts for your simulations, so that for each source you have various source orientations and depth
Test with different orientations and depths
Add noise, compute a noise covariance matrix from the simulated EEG, and use it to estimate the sources
Look at normalized maps (dSPM, sLORETA or Z-score)
 Is there any way to have nice and smooth data in each one without combining them?